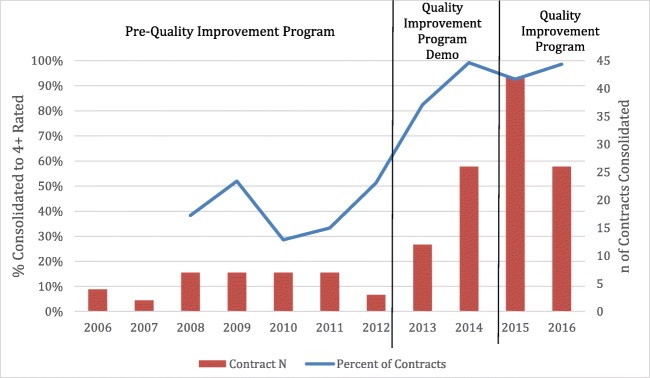
Figure 1.
Number of consolidated contracts and proportion consolidated to 4+ stars, 2006–2016. The bars correspond to the right axis and represent the number of contracts that consolidate each year. The line corresponds to the left axis and is the percent of contracts that were consolidated to a 4+ star contract. Each year represents a consolidation from that year into the following (i.e., 2006 represents the number of 2006 contracts and enrollees who were consolidated into a different plan in 2007). The first bonuses were paid during the demo starting in 2012. The program was made permanent in 2014. Star ratings were launched in 2009, so the line graph is unavailable for 2006–2007.

