
Figure 4.
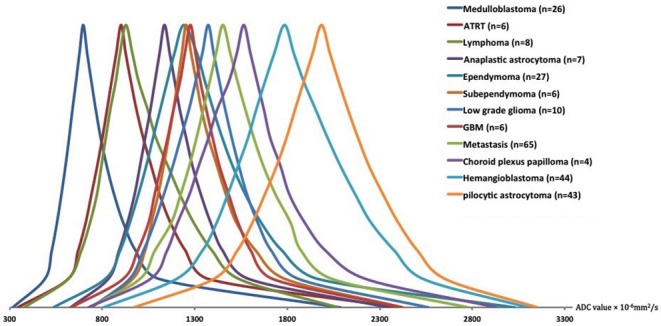
The schematic representation of the averaged ADC histogram distribution among different posterior fossa neoplasms. Medulloblastomas, ATRT, and lymphomas had the lowest; whereas, pilocytic astrocytomas, and hemangioblastomas had the highest ADC histogram percentile values. The average percentile values for each tumor type were calculated, and representative averaged histograms were modified so that the median values would be depicted at the same height on the y axis. ADC, apparent diffusion coefficient; ATRT, atypical teratoid/rhabdoid tumors; GBM, glioblastoma multiforme.