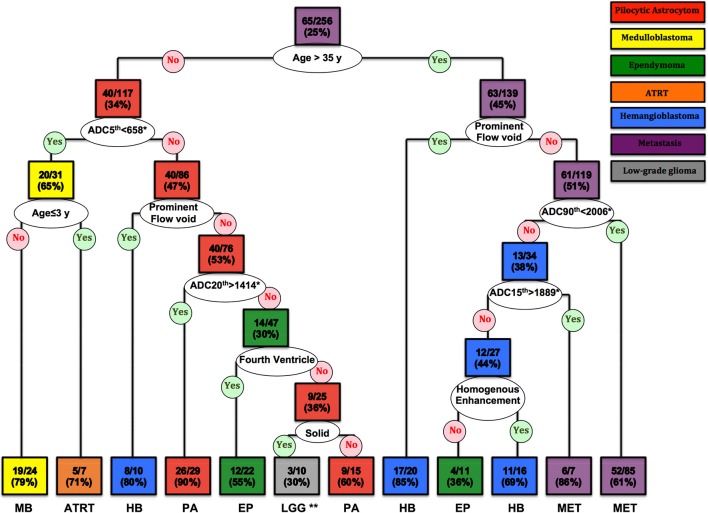
Figure 5.
The CART decision tree model could differentiate 7 histopathologies among posterior fossa tumors. In each box (node/leaf), the accurate classification rate (positive predictive value) is expressed as ratios of the most common tumor type per total number of cases fulfilling the criteria. Each box is colored to represent the tumor type, and the intensity of the color reflects the accurate classification ratio. ADC, apparent diffusion coefficient; ATRT, atypical teratoid/rhabdoid tumors; CART, Classification and Regression Tree; EP, Ependymoma; HB, Hemangioblastoma; LGG, low-grade glioma/astrocytoma; MET, metastases; MB, Medulloblastoma; PA, pilocytic astrocytoma. *The ADC nth refers to the ADC histogram nth percentile value ×10−6 mm2/s; for example, ADC 5th percentile <658 × 10−6 mm2/s. **Both low-grade glioma and anaplastic astrocytoma had 3/10 (30%) ratios in this terminal node.

