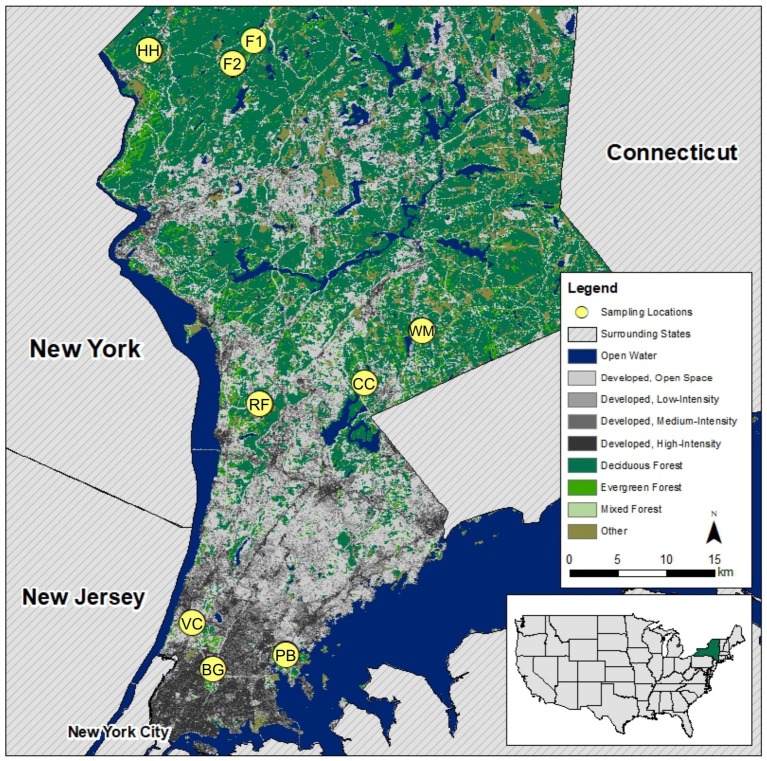
Figure 1.
Map of sampling locations along urban-to-exurban gradient showing developed land cover (from low to high intensity) in gray and forest in green adapted from the National Land Cover Database (NLCD) (2011) United States land cover dataset. Site code used throughout the manuscript is shown within the marker to identify each sampling location. Map in bottom-right corner locates New York State within the USA. Sites were classified as urban, suburban, or exurban based upon each site’s distance from Central Park in New York City, human population density, and GIS landcover analysis of percent-developed land within 5 miles of each study site.

