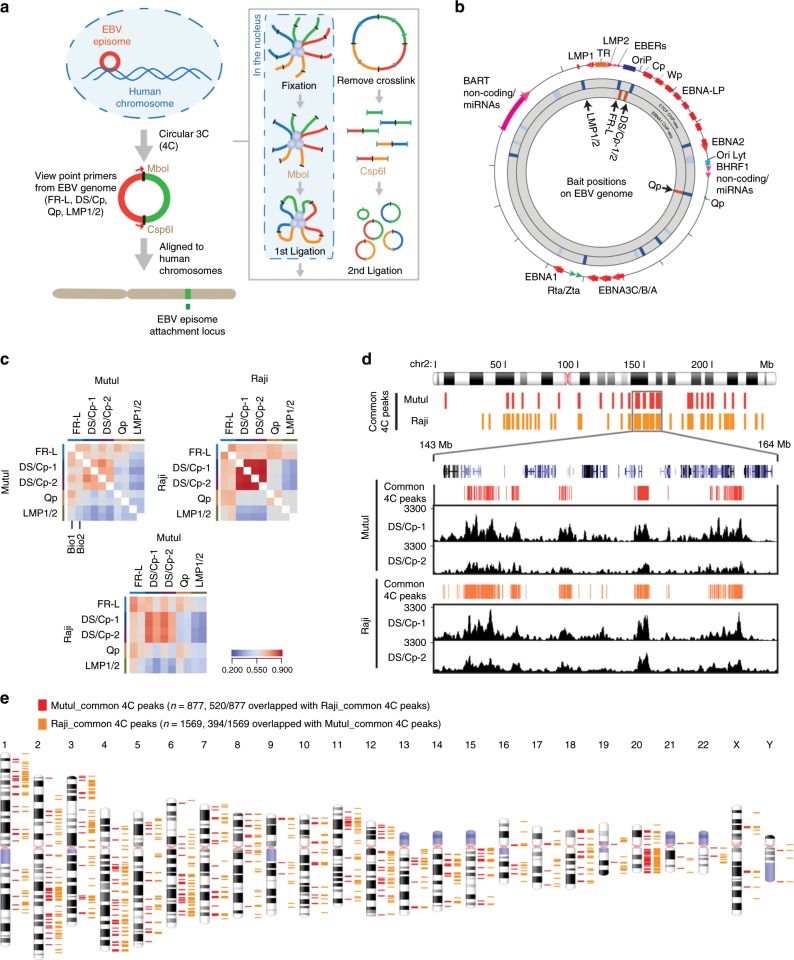
Fig. 1. 4C analysis of EBV-host DNA interactome.
a The 4C experimental procedure. b Baits positions at FR-L (Left), DS/Cp, Qp, and LMP1/2, on EBV genome. The positions of EBV genes and binding sites for CTCF and EBNA1 are indicated. c Heatmap showing the Pearson’s correlation coefficients of 4C-seq scores for 10 kb non-overlapped windows between baits from same (top) or different strains (bottom). d Example of 4C peaks for MutuI (DS/Cp-1,2) and Raji (DS/Cp-1,2) at the chr2: 143–164 Mb region with 10 kb resolution. e The 877 common 4C peaks for MutuI (red bars) and 1569 common 4C peaks for Raji (orange bars) are loaded on human all chromosomes with 10 kb resolution.

