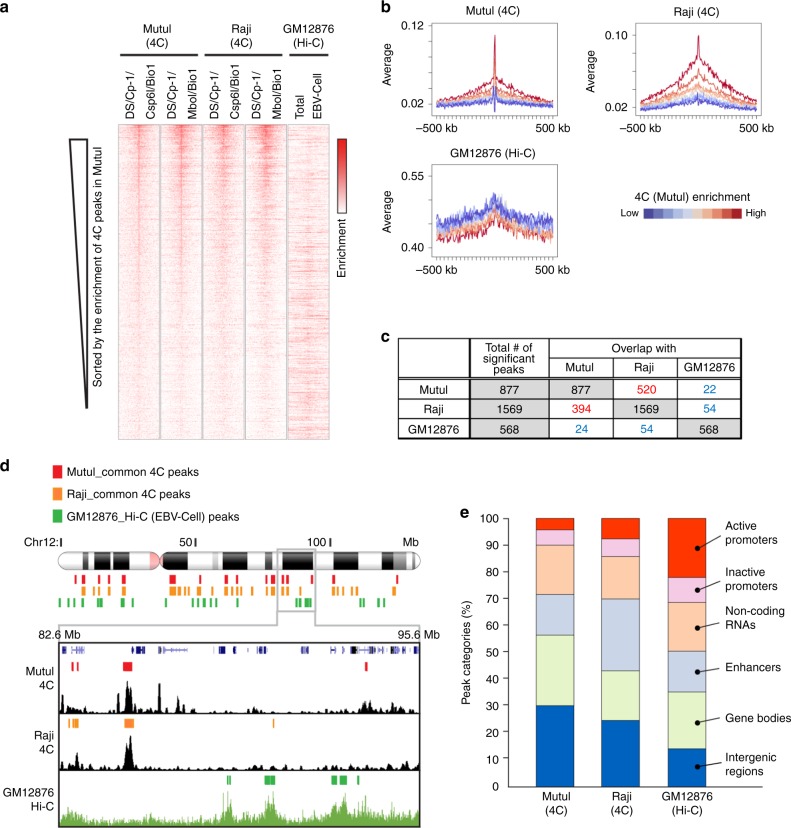
Fig. 4. Differences between LCL and BL cell tethering sites.
a Heatmap comparison of 4C in MutuI and Raji (DS/Cp-1/Csp6I/MboI) with Hi-C in GM12878. b Average enrichment of 4C peaks (DS/Cp-1/Csp6I) in MutuI and Raji and Hi-C peaks in GM12878 shown in panel a. The average enrichments are classified into 10 groups based on the 4C (MutuI/DS/Cp-1/Csp6I) scores (top: red → bottom: blue). c Table showing the number of overlapped peaks among MutuI (4C), Raji (4C), and GM12878 (Hi-C). d Example of 4C peaks for MutuI (DS/Cp-1/Csp6I/Bio1), Raji (DS/Cp-1/Csp6I/Bio1), and Hi-C peaks for GM12878 at the chr12: 82.6–95.6 Mb regions. e Distribution of EBV associating genomic loci at the indicated genetic elements.

