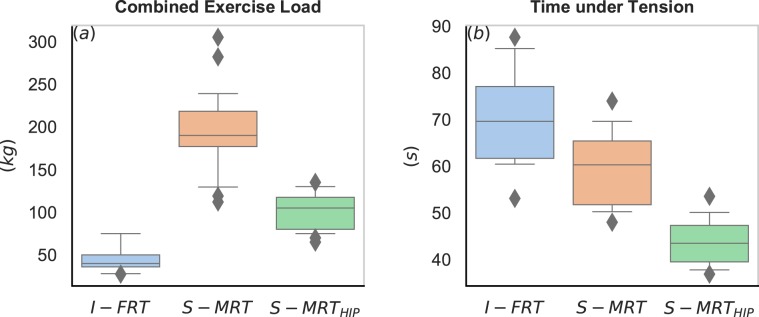
Figure 2.
Boxplots showing the maximal training load (a) and Time under Tension (b) during the last training phase. I-FRT = free-weight instability resistance training (blue), S-MRT = machine based stable resistance training (orange), S-MRTHIP = machine-based adductor/abductor training (green). The box shows the quartiles of the dataset while the whiskers extend to show the rest of the distribution. Outliers are plotted as individual diamond shaped points.

