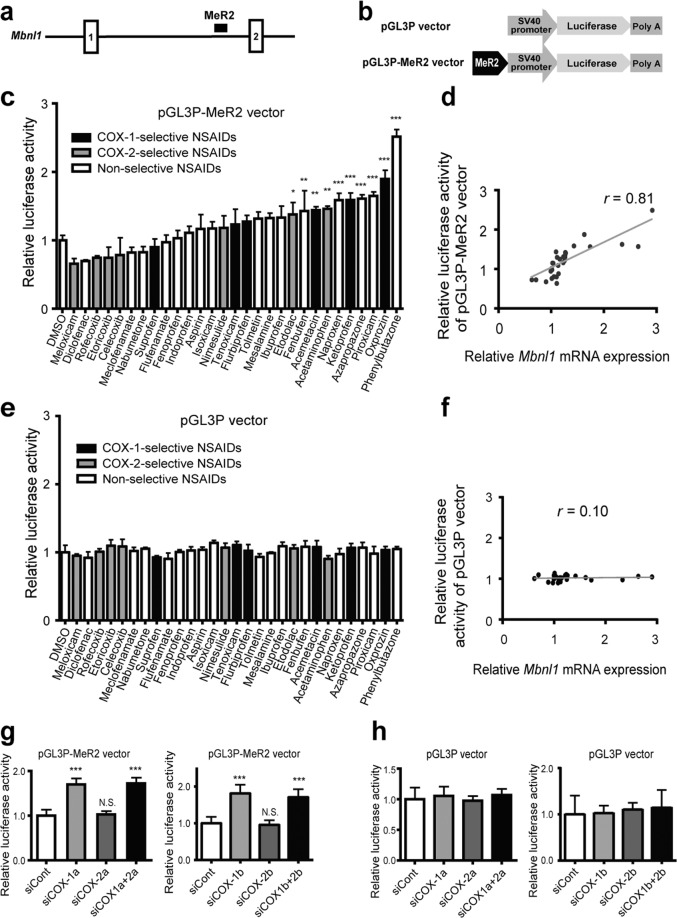
Figure 4.
Inhibition of COX-1-mediated pathway activates the MeR2 enhancer in Mbnl1 intron 1. (a) Schematic diagram showing the position of mouse MeR2 enhancer in Mbnl1 gene. Exons are shown by boxes, introns by thin lines, and MeR2 by a black closed square. (b) Schematic diagram of pGL3P vector and pGL3P-MeR2 vector. In pGL3P-MeR2, the MeR2 enhancer region was cloned into pGL3P upstream of the SV40 promoter and the firefly luciferase gene. (c,e) Luciferase activity of pGL3P-MeR2 (c) or pGL3P (e) in C2C12 cells treated with NSAIDs. The indicated NSAIDs were added to the culture medium at 24 h after transfection of the luciferase vectors, and were incubated for an additional 24 h. Then, the luciferase activity of pGL3P-MeR2 (c) or pGL3P (e) was measured, and was normalized to the Renilla luciferase activity of co-transfected pRL-CMV. The ratio was also normalized to that of control cells treated with 0.1% DMSO alone. Mean and SD (n = 3 culture dishes) are indicated. (d,f) Correlation between the relative Mbnl1 mRNA expression (Fig. 1) and the relative luciferase activity of pGL3P-MeR2 (d) or pGL3P (f) for each NSAID normalized for 0.1% DMSO. Pearson’s correlation coefficient (r) is indicated. (g,h) Luciferase activity of pGL3P-MeR2 (g) or pGL3P (h) in COX-1 or COX-2-knocked down cells. C2C12 cells were transfected with siRNAs against COX-1 (siCOX1-a or siCOX1-b), COX-2 (siCOX2-a or siCOX2-b), both COX-1 and COX-2 (siCOX1a + 2a or siCOX1b + 2b), or control siRNA (siCont) at 24 h after transfection of the luciferase vectors, and were incubated for an additional 48 h. Firefly luciferase activity was normalized to the Renilla luciferase activity of co-transfected pRL-CMV, and also to siCont-transfected cells. Mean and SD (n = 8 culture dishes) are indicated. *p < 0.05, **p < 0.01, ***p < 0.001, and N.S., not significant by Student’s t-test with Bonferroni multiple comparison correction.

