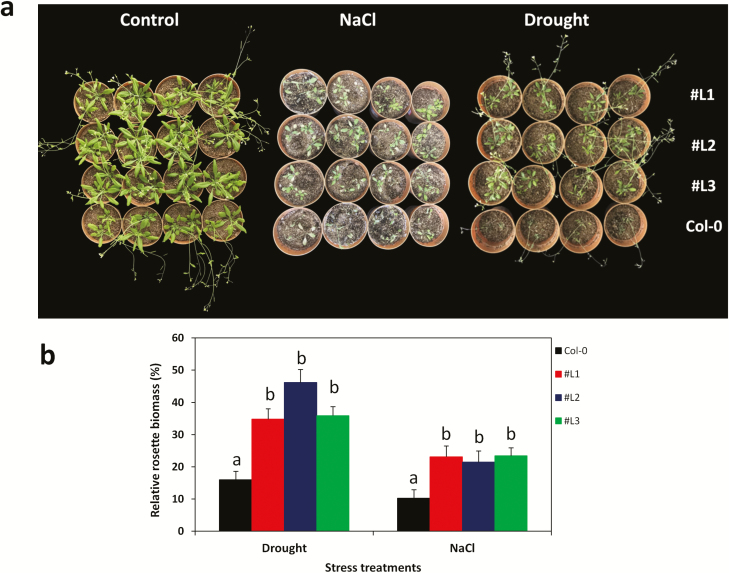
Figure 5.
Drought and salt stress tolerance assay at the seedling stage of Arabidopsis SiMYB75 over-expressing lines (#L1, #L2 and #L3) and wild type plants (Col-0). (a) Phenotypes of the transgenic and Col-0 plants in control, sodium chloride (NaCl) (200 mM for 7 days) and drought (17 days water withholding) treatments; (b) relative rosette biomass estimated as the ration of the dry weight in the stress and control treatments. For each experiment, 8 plants/lines were used. Data represent means ± SD from one experiment and the experiment was repeated once more and similar results were obtained. Different letters above bar mean significant difference between each transgenic line and Col-0 at P ≤ 0.05.

