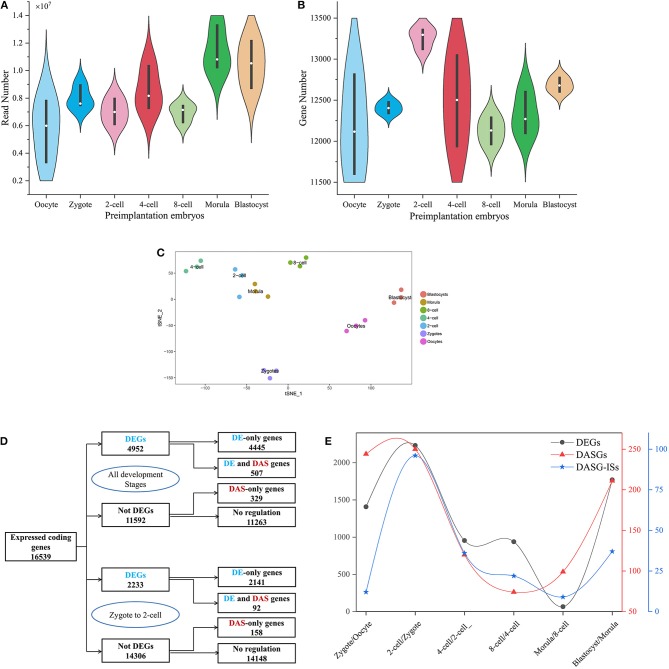
Figure 1.
A schematic description of dataset, DEGs and DAS. (A,B) is the frequency distribution of reads mapped to protein-coding genes and protein-coding genes captured at every preimplantation development stage. The white circle denotes median of all values. Black rectangle denotes interquartile range (quartile to third quartile). (C) Cell type assignment using the most variable genes across all preimplatation development stages following t-SNE-based visualization of 21 cells. Cells that marked with same color were clustered at the same developmental stage. (D) The number of DEG and DASGs at all preimplantation development stages. The blue denotes DEGs and the red denotes DASGs. (E) The number of DEGs, DASGs and DASG-ISs for every consecutive stages of preimplantation development. DASGs represent genes in which DAS was identified. DAS-ISs represent isoform switches identified from DASGs.

