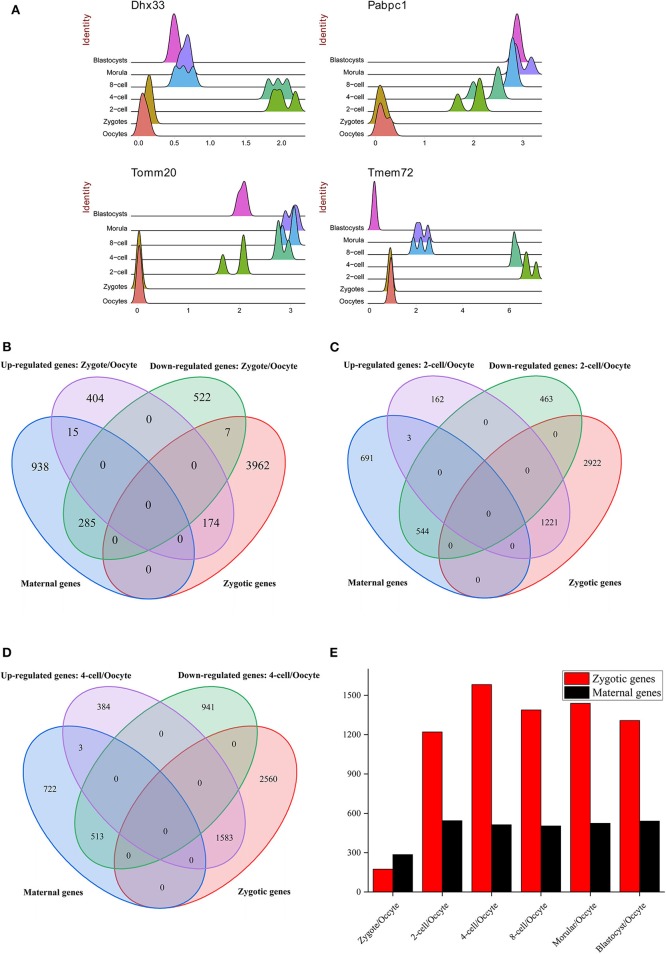
Figure 2.
The distribution of DE genes. (A) The expression atlas of significantly up-regulated genes in different preimplantation development stages. The gene expression level was normalized by Seurat (see Materials and Methods). (B–D) The intersection between DE genes (B: zygote/oocyte, C: 2-cell/oocyte, D: 4-cell/oocyte) and maternal/zygotic genes. The maternal and zygotic gene sets were derived from Fan et al. (2015). (E) The distribution of DE genes overlapped with maternal and zygotic genes. Zygotic genes marked with red color denotes the up-regulated genes overlapped with zygotic genes from Fan et al. (2015). Maternal genes marked with black color denotes the down-regulated genes overlapped with maternal genes from Fan et al. (2015).

