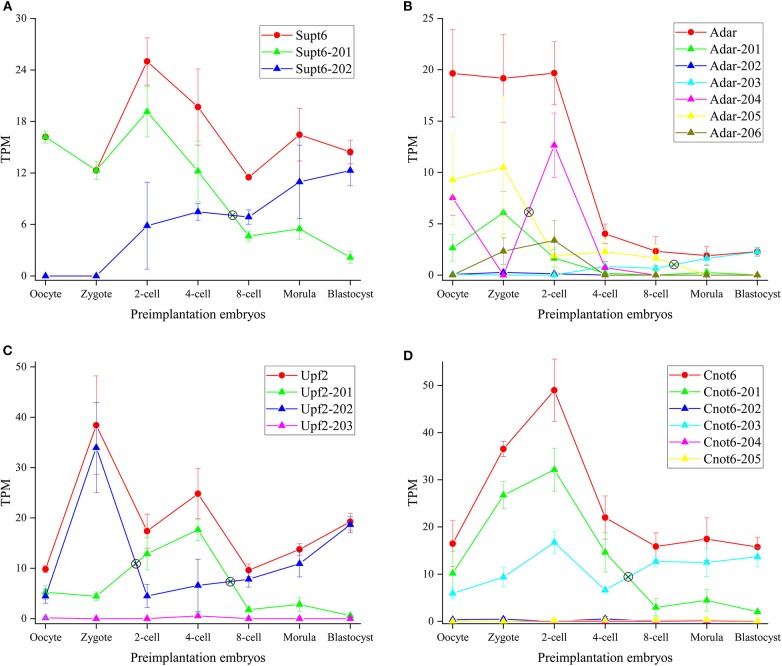
Figure 7.
Expression profiles of DASGs. (A–D) Represent the gene and transcript expression profiles of Supt6, Adar, Upf2 and Cnot6, respectively. The y-axis denotes TPM (Transcripts Per Kilobase Million). The symbol ⊗ denotes switch point. The red line denotes gene expression level and other color lines denote transcript expression level.

