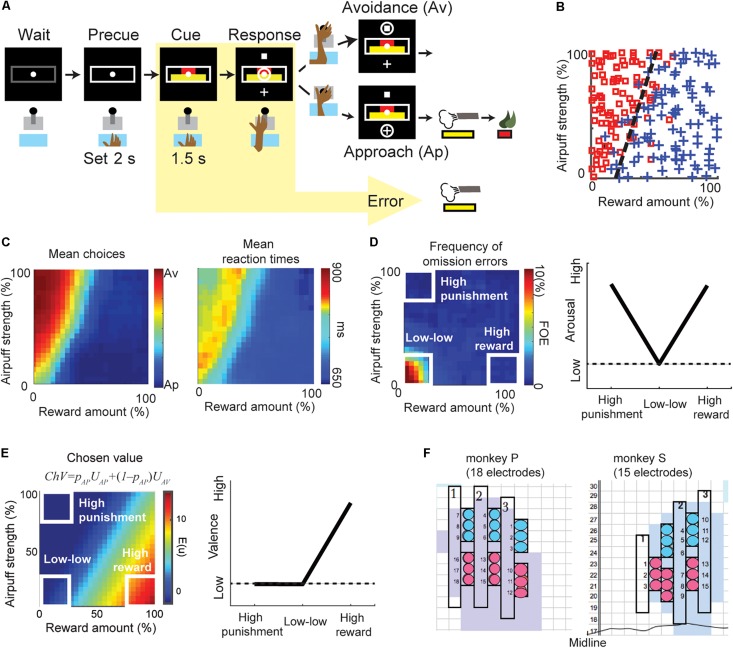
FIGURE 1.
The behaviors of the Ap–Av decision-making task. (A) Task procedure of the Ap–Av decision-making task. During the cue period, the red and yellow horizontal bars, respectively signaling the offered amounts of reward and punishment, appeared on the monitor. The monkeys decided between acceptance and rejection of the combined offer and reported it by choosing either of two targets (cross for Ap; square for Av) that appeared during the response period. Locations of the targets were alternated randomly. When the monkey did not respond during the response period, the trial was counted as an omission error. (B) The Ap–Av choice pattern in a single session. The x-axis indicates the offered reward amount, and the y-axis shows the offered airpuff strength. Blue crosses indicate Ap choice. Red squares indicate Av. (C) Mean Ap–Av choices (left). Mean reaction times (RTs) mapped onto the decision matrix (right). Each datum was spatially smoothed by a square window (20% by 20% in the decision matrix). (D) Frequency of omission errors (FOE) (left) and the schematic of arousal (right). When the monkey did not move the joystick during the 3-s response period, the trial was regarded as an omission error. To compare the valence and arousal, we focused on the “high-reward,” “high-punishment,” and “low–low” condition (right). We observed omissions almost exclusively at the “low–low” condition punishment offer, suggesting that both reward and punishment facilitated task engagement. Arousal level was thus defined as a V-shape relationship as it became high either in the “high-punishment” or in the “high-reward” condition (left). (E) The chosen value (ChV) (left) and the schematic of valence (right). The ChV corresponds to the expected outcome value associated with the selected option. We defined valence by the ChV. Valence became high in the “high-reward” condition and low in the “low–low” condition. It became zero in the “high-punishment” condition as the monkey always chose Av in the condition. (F) Positions of the implanted electrodes (circles) on the recording grid system for monkey P (left) and monkey S (right). Grids were placed on the skull with 5° tilt from the horizontal plane. Electrodes were implanted in the anterior portion of the CN (light blue shading). The numbers along the midline indicate the intra-aural anterior-posterior coordinates of the grid system in millimeter. The color of the circles indicates the group of electrodes that shared the same reference signal.

