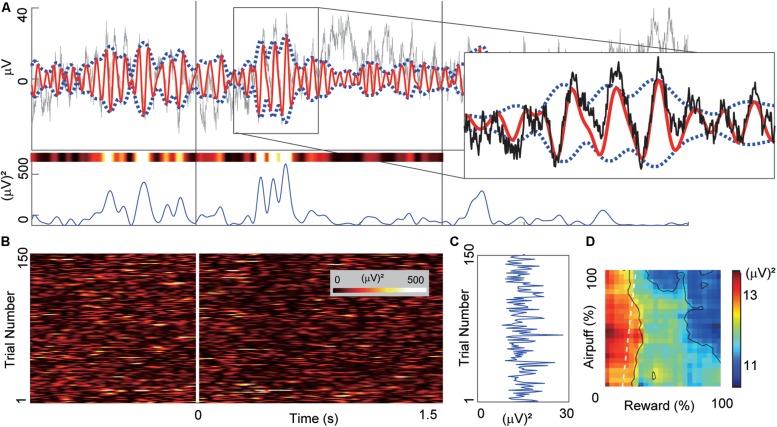
FIGURE 2.
Example of beta oscillation recorded from a CN electrode. (A) Example of the LFP activity recorded from a CN electrode aligned to the onset of the cue period. The time scale is the same as in (B). Gray and red lines in the top panel indicate the LFP activity and the band-pass-filtered (13–28 Hz) activity. We derived the power magnitude using the difference between the upper and lower envelopes that were represented by blue dotted lines. The right inset shows a magnified view of the region inside the rectangle. The bottom panel shows the power magnitude of the envelopes. The variously colored bar above the power trace shows the same power data color-coded using the same color scale as in (B). (B) The trial-by-trial power magnitudes as a pseudo-colored raster plot (inset shows color scale). The x-axis indicates the time from the cue onset. Y-axis indicates the trial number. (C) The mean power of the beta magnitudes averaged over the 1.5-s cue period. (D) The beta response that was produced by mapping the cue-period mean power onto the decision matrix. The mapped data were spatially smoothed by a 20%-by-20% square window. X-axis and Y-axis indicate the offered sizes of reward and punishment, respectively.

