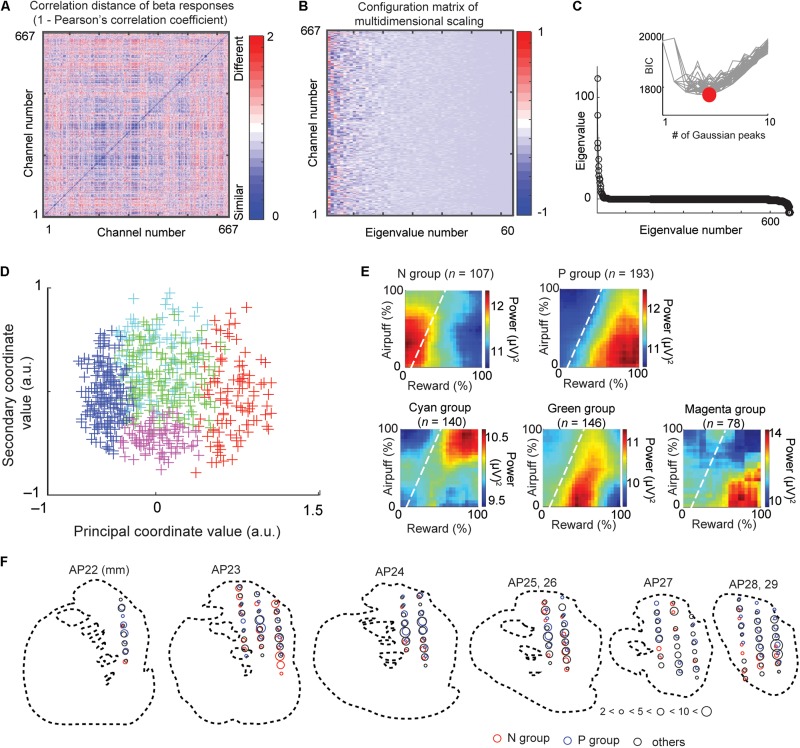
FIGURE 3.
Multidimensional scaling and clustering of beta responses. (A) Matrix of correlation distance between pairs of all beta response matrices (D = [dij]). The color of each element shows the correlation distance (dij = 1 - rij), where rij is the cross-correlation between decision matrices of beta response i and response j. (B) Configuration matrix derived from the multidimensional scaling. (C) Eigenvalues showing the explanatory power of each feature dimension. Inset shows the BIC values for different numbers of Gaussian peaks. Gray lines indicate the BIC values for each of many independent runs of a procedure that did the mixture-of-Gaussian fitting for each number of peaks from 1 to 10. The minimum BIC was given by five Gaussian peaks and denoted as a red circle. (D) Beta response matrices projected onto the first two dimensions of the MDS. Each cross indicates an individual channel. The color indicates the group that the channel belongs to (red: N group, blue: P group, green, cyan, and magenta: other groups). (E) The group means of beta responses in the decision matrix. Each group (N, P, cyan, green, or magenta group) was defined by the MDS clustering shown in (D). (F) Spatial distribution of sites at which we recorded LFPs classified as N (red), P (blue), and other (black) groups. The size of each circle indicates the number of LFPs at the location. Data from monkey S were projected onto outline drawings of the striatum of monkey P.

