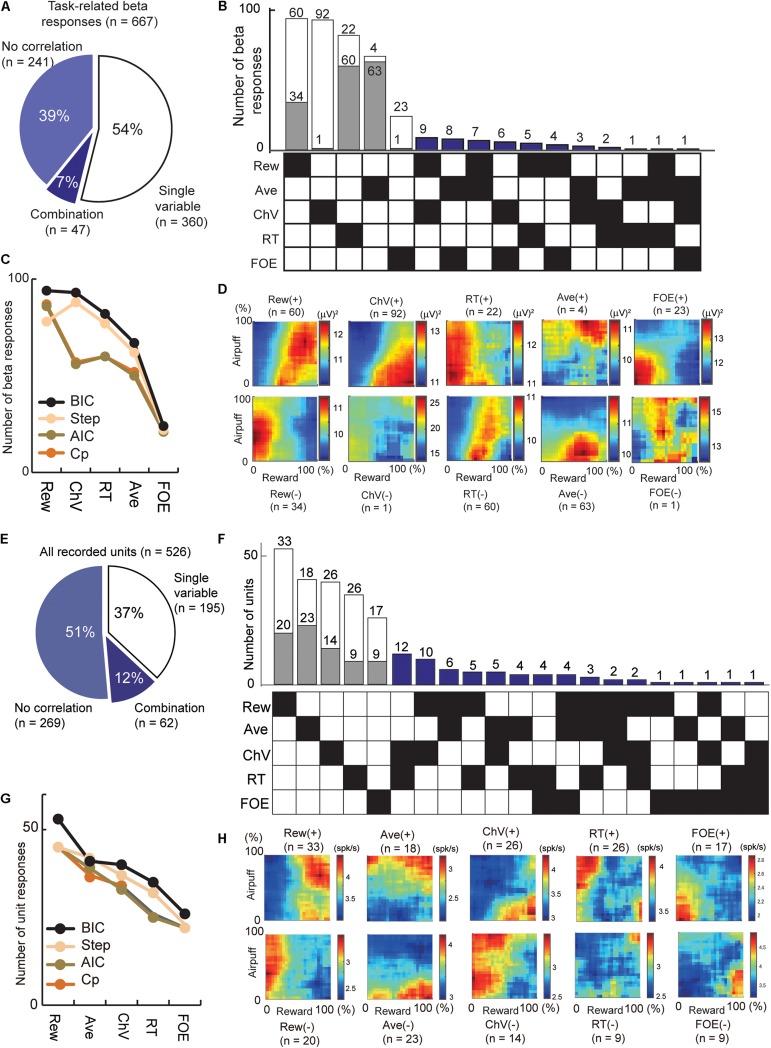
FIGURE 4.
Regression analyses that extract the information encoded by the cue-period beta magnitudes and cue-period unit activities. (A) The number of beta responses classified by all-possible subset regression. The proportion of cue-period beta magnitudes explained by a single (54%) and combination (7%) of variables. (B) All-possible subset regression analysis of beta responses using the five explanatory variables (Rew, Ave, ChV, RT, and FOE), sorted in decreasing order of total number responses explained. The 360 responses explained by single variables were further separated into channels with responses that were correlated positively (white) or negatively (gray) with the variable. Forty-seven beta responses were characterized by particular combinations of variables indicated by black squares in the matrix on the bottom. (C) Classification of beta responses with all-possible subset regression analyses performed with different criteria (black, BIC; brown, AIC; orange, Mallow’s Cp), and stepwise regression analysis (cream). Y-axis is the number of beta responses where the best model was the single variable on the x-axis. (D) The population activity of the beta responses explained by single variables, sorted as in (B). Those correlated positively (+) and negatively (−) with the variables were separately categorized. (E) The number of unit activities classified by all-possible subset regression. The proportion of the cue-period unit activities explained by a single (37%) and combination (12%) of variables. (F) All-possible subset regression analysis of unit responses using the five explanatory variables (Rew, Ave, ChV, RT, and FOE), sorted in decreasing order of total number responses explained. The cue-period unit activities of 195 units were explained by single variables and were further separated into channels with responses that were correlated positively (white) or negatively (gray) with the variable. The activities of 62 units were characterized by particular combinations of variables indicated by black squares in the matrix on the bottom. (G) Classification of units with different criteria as in (C) (black, BIC; brown, AIC; orange, Mallow’s Cp; stepwise regression analyses, cream). (H) The population activity of the unit responses explained by single variables, sorted as in (F). Those correlated positively (+) and negatively (−) with the variables were separately categorized.

