FIGURE 5.
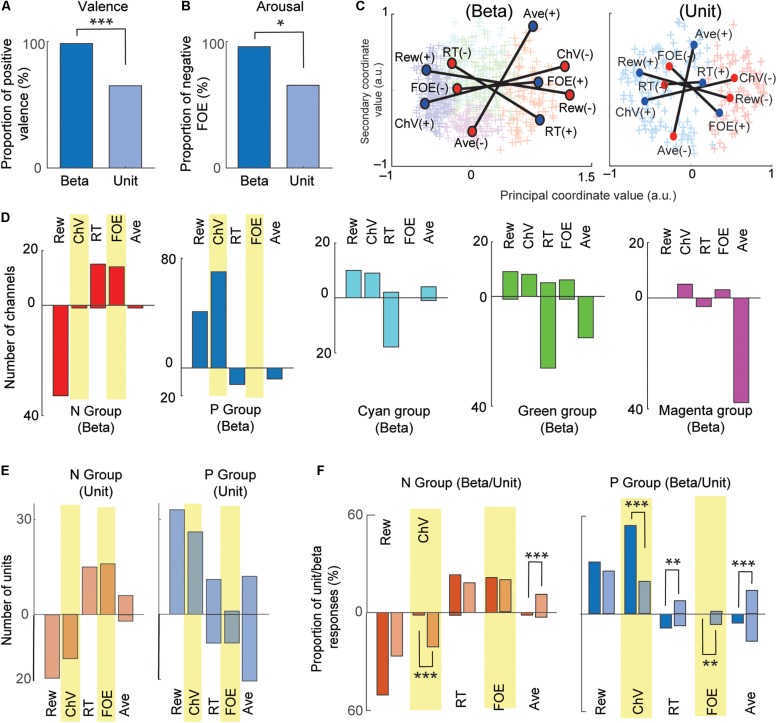
Comparison between beta and unit that encoded valence and arousal. (A) Comparison between valence-encoding beta and valence-encoding unit responses. The percentage of positive-valence beta responses was significantly larger than that of unit responses (Fisher’s exact test, ***P < 0.001). (B) Comparison between the arousal-encoding beta and unit responses. The percentage of the negative-arousal beta responses was significantly larger than that of unit responses (Fisher’s exact test, *P < 0.05). (C) MDS clustering for the beta (left) and unit (right) responses. The beta and unit responses were projected onto the first two dimensions of the MDS (MDS map). Each cross indicates an individual response. Two groups (P and N groups) were defined by the Gaussian mixture model. The positions of the five explanatory variables were projected onto the MDS map. Blue and red circles indicate, respectively, positive and negative correlation with the variables. (D) The representation of beta responses for each group identified by the MDS clustering. The number of beta responses encoding the five behavioral variables shown separately for each group. The stacked bars that go up indicated positive correlations, and those that go down indicated negative correlations. (E) The representation of unit responses for N and P groups identified by the MDS clustering. Stacked bars that go up and down indicate positive and negative correlations, respectively. (F) Comparison of beta and unit responses in the P and N groups (dark colors, beta; light colors, units). Stacked bars that go up and down indicate positive and negative correlations, respectively. Statistically significant differences between the proportion of units and proportion of beta are marked (Fisher’s exact test, ***P < 0.001, **P < 0.01).

