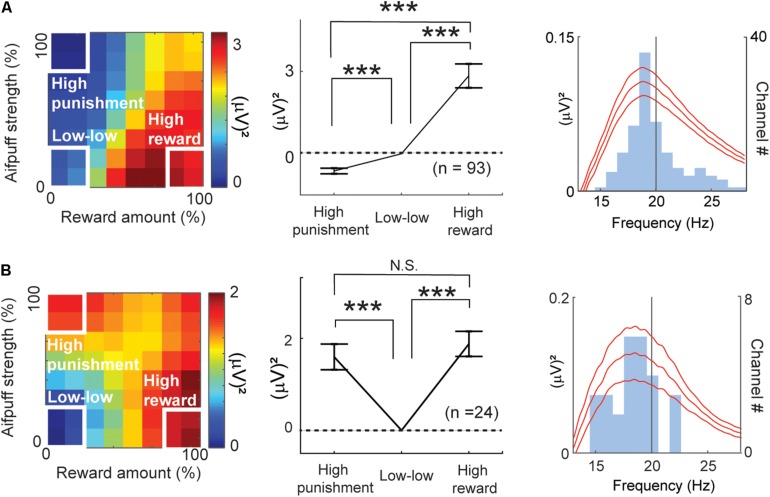
FIGURE 7.
Features of beta responses encoding valence and arousal. (A) Features of valence-encoding beta responses. The left panel shows the mean of the differential activity from the “low–low” condition for the valence-encoding beta responses. Activities of valence-encoding beta responses were mapped onto the decision matrix. Those of ChV(+) beta responses were added, and those of ChV(−) were subtracted. The middle panel shows the mean increase in activities from the “low-low” condition. The valence-encoding beta responses discriminated the “high-punishment” and “high-reward” conditions (Paired t-test, ***P < 0.001), showing differential responses to reward and punishment. The right panel shows the mean (±SEM) power spectra of the valence-encoding beta responses (baseline-subtracted), peaking at 18.7 Hz. The light blue histogram indicates the distribution of peaks of power spectra. (B) Features of arousal-encoding beta responses. The left panel shows the mean of the differential activity from the “low–low” condition for arousal-encoding beta responses. Activities of FOE(−) beta responses were added, and those of FOE(+) were subtracted. The middle panel shows the mean increase in activities from the “low–low” conditions. The activities in the “high-punishment” and “high-reward” were significantly higher than those in the “low–low” condition (Paired t-test, ***P < 0.001). The arousal-encoding beta responses did not discriminate the “high-punishment” and “high-reward” conditions (N.S.: P = 0.47 > 0.05). The right panel shows the mean (±SEM) power spectra of the arousal-encoding beta responses (baseline-subtracted), peaking at 18.9 Hz. The light blue histogram indicates the distribution of peaks of power spectra.

