FIGURE 8.
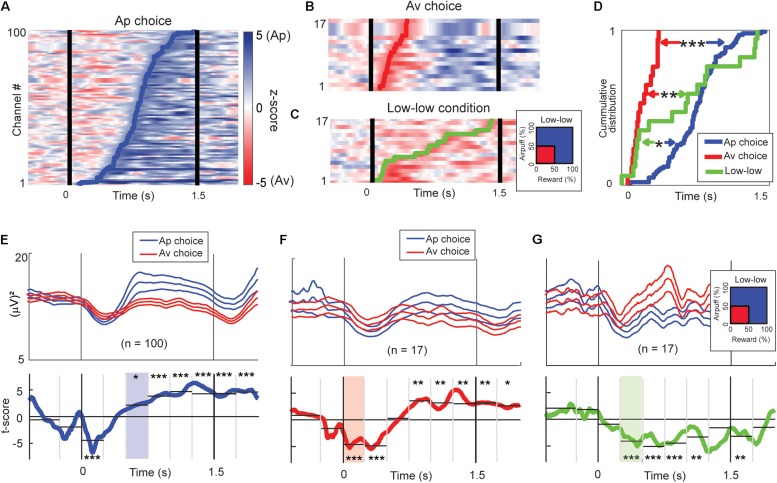
Time-course of beta responses encoding valence and arousal. (A) The time-course of Ap–Av discrimination ability for each Ap-responding beta channel represented by z-score of the Wilcoxon rank-sum test. The z-scores are shown as pseudocolor rasters, with shades of blue indicating higher power for Ap choice, and red indicating higher power for Av choice. We defined the onset of choice discrimination as the earliest time at which the test returned P < 0.05 consecutively for more than 100 ms. The blue line indicates the onset of the increase of the beta magnitude for the Ap choice. (B) The time-course of Ap–Av discrimination ability for each Av-responding beta channel, as in (A). The red line indicates the onset of the increase of the beta magnitude for the Ap choice. (C) The time-course of discrimination ability for different arousal conditions. The z-scores are shown with shades of blue indicating higher power for high arousal conditions, and red indicating higher power for the “low–low” condition. The green line indicates the onset of the increase of the beta magnitude for the “low–low” condition. (D) The cumulative onset times at which beta responses discriminated between upcoming Ap and Av choices or between high and low arousal levels. The onsets of increase in the magnitude for the Av choice (red line) were significantly earlier than those for the “low–low” conditions (green line; **P < 0.01, Kolmogorov–Smirnov test) and for the Ap (blue line) choice (***P < 0.001). The onsets of increase for the “low–low” conditions were significantly earlier than those for the Ap choice (*P < 0.05). (E) Means (±SEM) of the beta power time course of the Ap-responding channels (top; blue traces = Ap, red traces = Av). Two-sided t-tests were performed for the time points to show the t-scores (bottom, blue line) of the differential activity between Ap and Av choices. We aggregated the activities into 250-ms bins to derive the significance level of the discrimination (*P < 0.05, **P < 0.01, ***P < 0.001, two-sample t-test). The light blue shows the first bin that showed a significant increase in the Ap condition. (F) Means (±SEM) of the beta power time course of the Av-responding channels (top; blue traces = Ap, red traces = Av). We also show the t-scores (bottom, red line) of the differential activity between Ap and Av choices (bottom). The light red indicates the first bin first, which showed a significant increase in the Av condition. (G) The group means (±SEM) of the beta power time course of the channels that showed an increase for the “low–low” condition (top; red traces = “low–low”). We also show the t-scores (green line) of the differential activity for the “low–low” and other conditions (bottom). The light green indicates the first bin that showed a significant increase in the “low–low” condition.

