Figure 5.

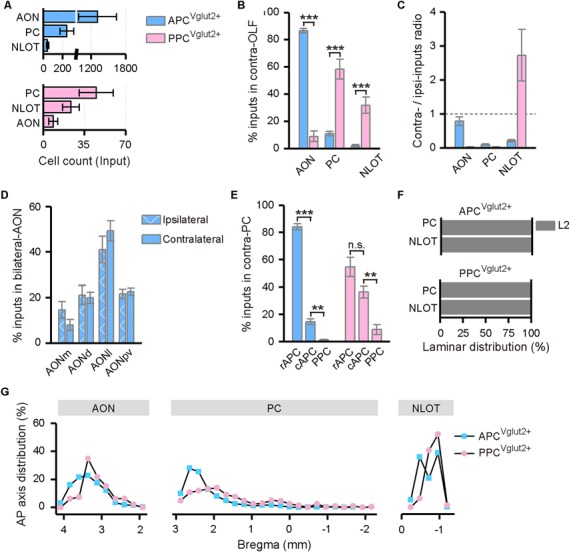
Distribution patterns of contralateral OLF inputs. (A) Numbers of the input neurons in different areas of the contralateral OLF. (B) Distribution of the input neurons within the contralateral OLF. (C) Contralateral-ipsilateral ratio of the input neurons in the AON, PC and NLOT. (D) Distribution of the input neurons within the bilateral AON in the APCVglut2+ tracing group. The AON was mainly divided into the AONd, AONm, AONl and AONpv. (E) Distribution of the input neurons within the contralateral PC. The APC was further divided into the rostral (rAPC) and caudal (cAPC) parts. (F) Laminar distribution of the input neurons in the contralateral PC and NLOT. (G) Distribution patterns of the input neurons along the AP axis in different areas of the contralateral OLF. ns., no significant difference; **P < 0.01 and ***P < 0.001.
