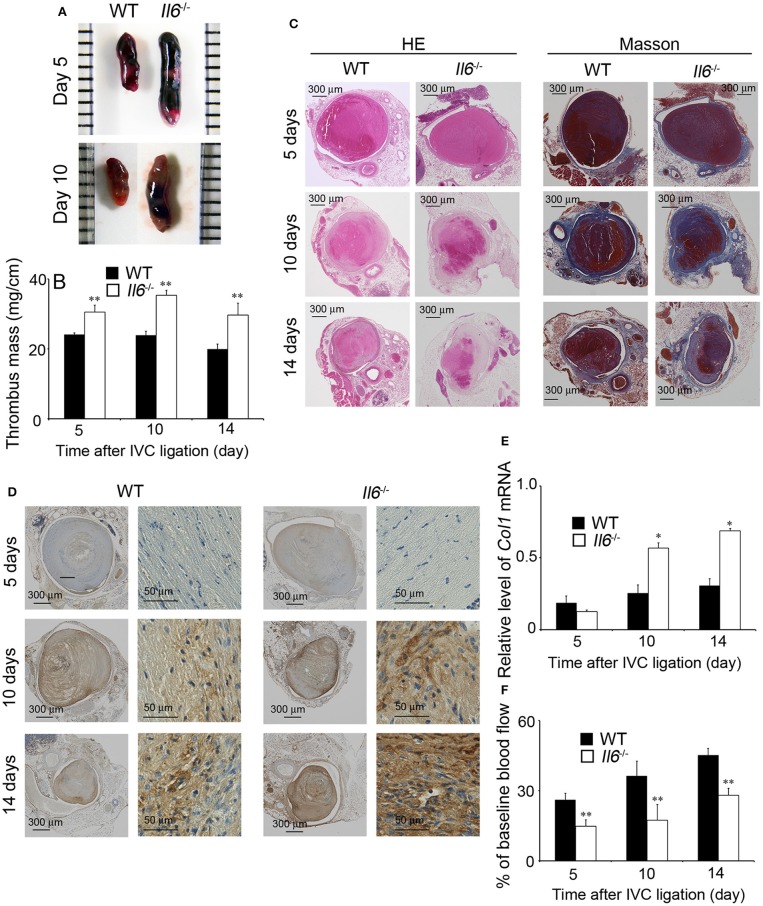
Figure 2.
Inferior vena cava (IVC) ligation-induced deep vein thrombus formation in wild-type (WT) and Il6−/− mice. (A) Macroscopic appearance of venous thrombi in WT and Il6−/− mice at 5 and 10 days after IVC ligation. Representative results from six independent animals are shown here. (B) Thrombus mass of WT and Il6−/− mice at the indicated time intervals after IVC ligation. All values represent the mean ± SEM (n = 6). **p < 0.01, WT vs. Il6−/−. (C) Histopathological analyses of venous thrombi obtained from WT and Il6−/− mice at 5, 10, and 14 days after IVC ligation. Venous thrombi were stained with hematoxylin and eosin (H&E) or Masson trichrome solution (Masson). Representative results from six independent experiments are shown here (original magnification, ×100). (D) Immunohistochemical detection of Col1A2 proteins in the thrombi obtained from WT and Il6−/− mice at 5, 10, and 14 days after IVC ligation. (E) Intrathrombotic Col1 gene expression in WT and Il6−/− mice at the indicated time intervals after IVC ligation. All values represent the mean ± SEM (n = 6). *p < 0.05, WT vs. Il6−/−. (F) Laser Doppler analysis of thrombosed blood flow. All values represent the values mean ± SEM (n = 6 animals). **p < 0.01, WT vs. Il6−/−.

