
Figure 1.
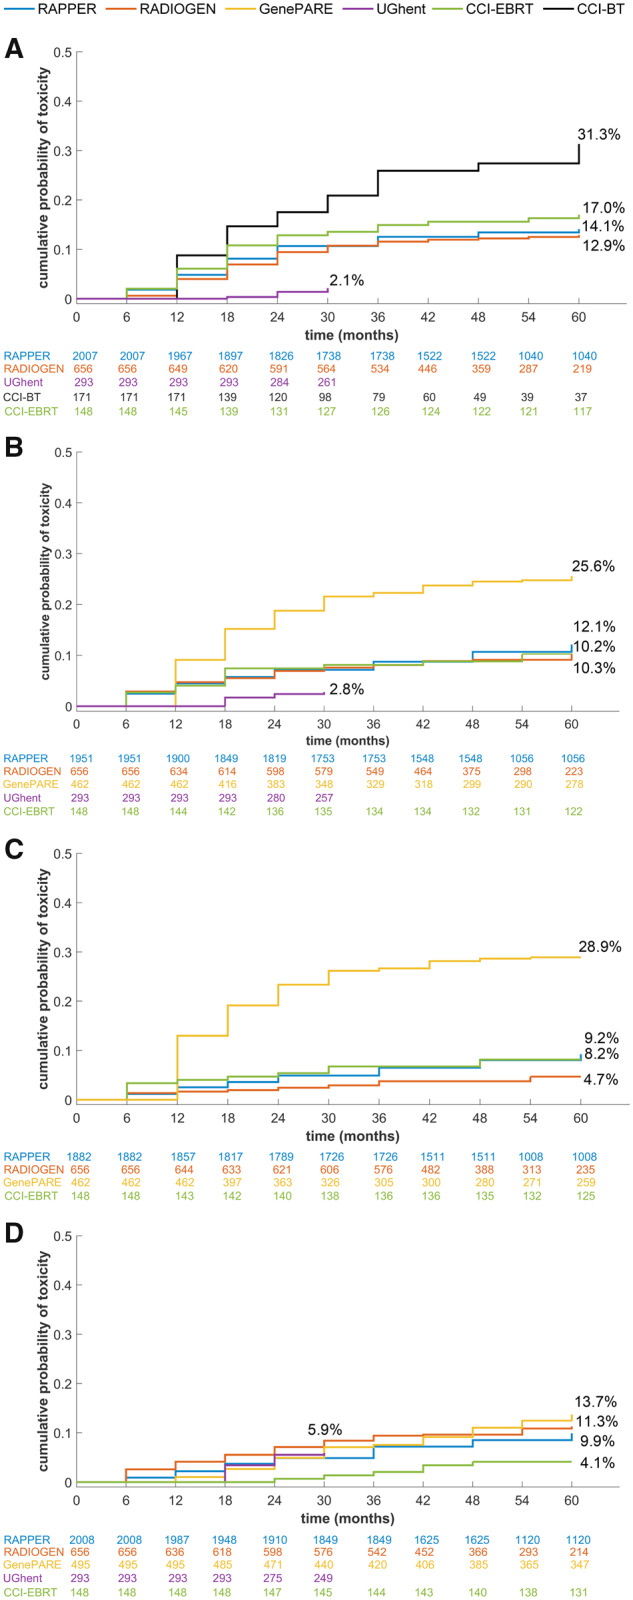
Cumulative probability of radiotoxicity. Each graph shows the cumulative probability of developing grade 2 or worse radiotoxicity for each individual outcome within each study included in the genome-wide association study meta-analysis. These outcomes include (A) rectal bleeding, (B) increased urinary frequency, (C) decreased urinary stream, and (D) hematuria. Numbers listed below the x-axis for each graph represent the numbers of patients at risk.