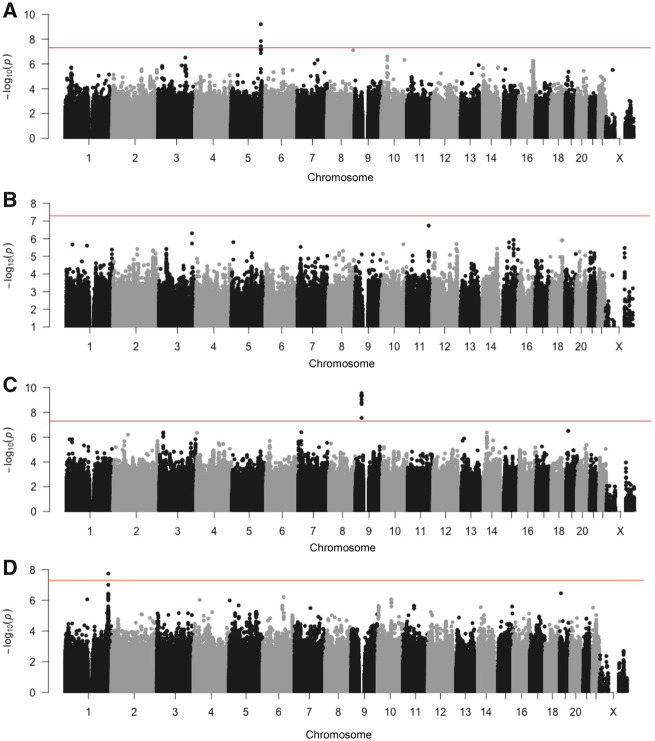
Figure 2.
Manhattan plots. The graphs show association results for (A) rectal bleeding, (B) increased urinary frequency, (C) decreased urinary stream, and (D) hematuria. The red line denotes -log P value = 5 × 10⁻⁸. Each point represents a single nucleotide polymorphism, with numbers on the x-axis denoting chromosome number.

