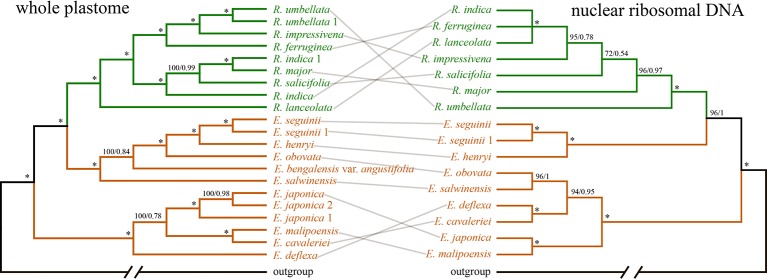
Figure 5.
COMPARISONS of the phylogenies based on Bayesian inference of the whole plastid genome (WP: left) and nuclear ribosomal DNA (nrDNA) repeats (right). Branches are colored by genera. Numbers associated with the branches are ML bootstrap value (BS) and BI posterior probabilities (PP), and asterisks (*) indicate bootstrap support/posterior probability of 100/1.00.

