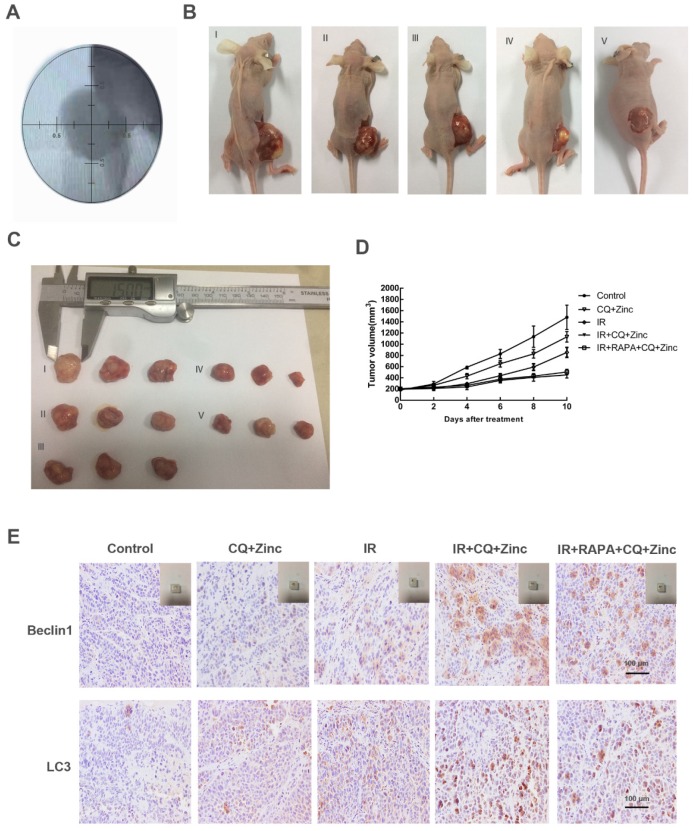
Fig 7.
CQ combined with zinc inhibited tumor growth in vivo. (A) Simulation position before IR. (B) Representative image of tumor growth in different treatments (I, II, III, IV, V represent control, CQ+Zinc, IR, IR + CQ + Zinc, IR + RAPA + CQ +Zinc respectively). (C) Gross view of tumor. (D) Growth curve of tumor volume. (E) Representative immunohistochemistry staining images of Beclin1 and LC3 in tumor tissue.

