Figure 1.
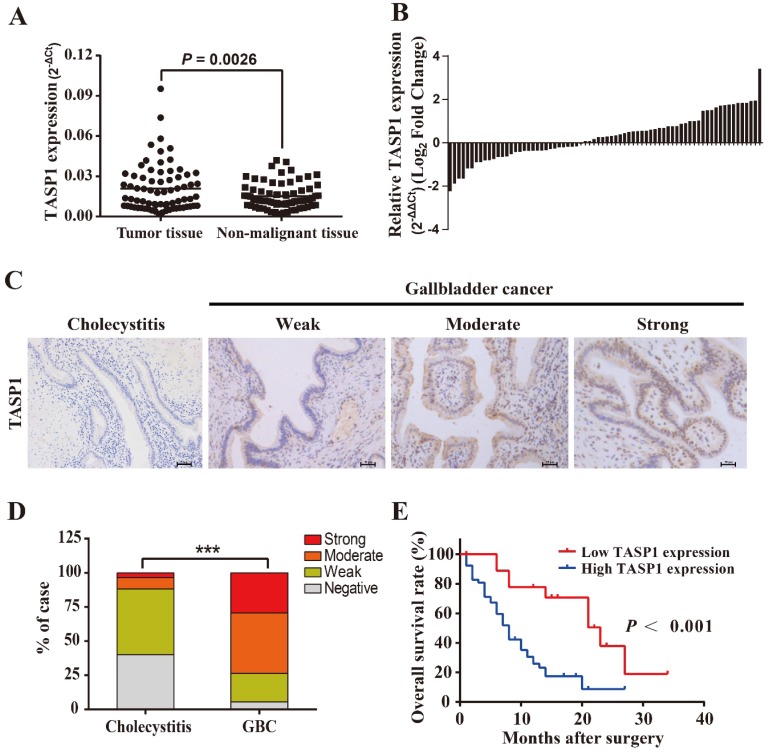
TASP1 is overexpressed in GBCs and correlated with poor survival of GBC patients. (A) TASP1 expression in GBC tissues and matched non-malignant tissues was evaluated by qRT-PCR. (B) TASP1 expression levels were compared between GBC tissues and their corresponding adjacent tissues. (C) IHC analysis of TASP1 protein expression level (scale bar, 50 μm). Representatives images of cholecystitis and GBC with weak, moderate, strong staining. (D) The percentage of different TASP1 staining in the cholecystitis and GBC tissues. (E) Kaplan-Meier overall survival curve of GBC patients based on TASP1 expression. Low TASP1, n=19; high TASP1, n=53.

