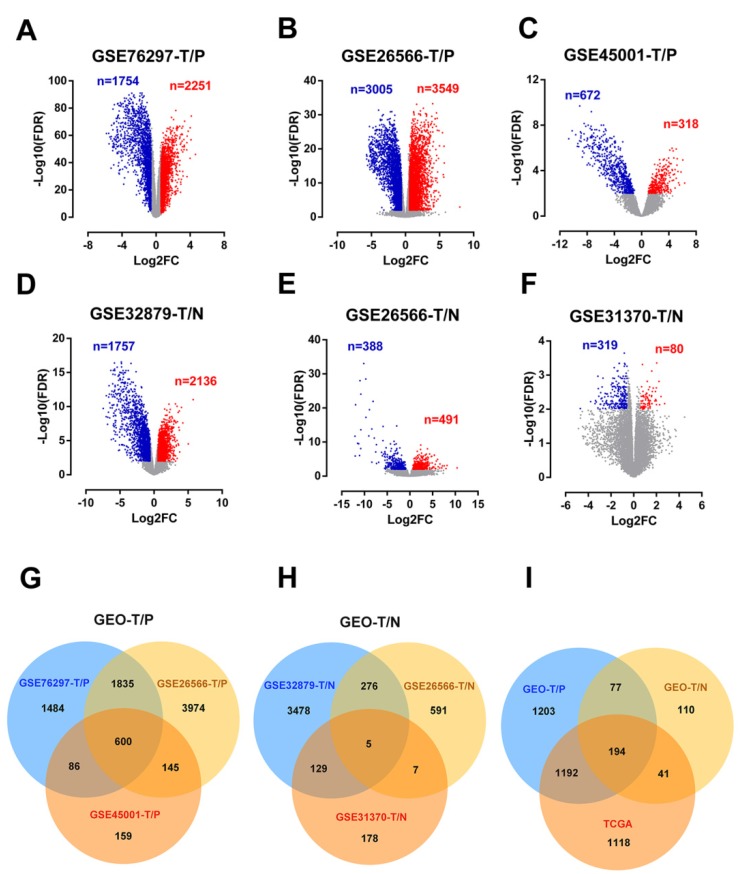
Figure 1.
Identification of differentially expressed genes in cholangiocarcinoma from public CCA datasets. (A-F) Volcano plots of DEGs in the 5 indicated datasets. (X-axis: log2(FC); Y-axis: -log10(FDR) for each gene. Genes with FDR < 0.01 and FC >1.5 or <-1.5 were considered as DEGs in each series. Blue: down-regulated genes; Grey: non-differential genes; Red: up-regulated genes). (G-H) Overlapping analyses of DEGs in TvsP (G) and TvsN (H) groups, DEGs shared within 2 datasets or more were regarded as credible DEGs in each Venn diagram. (I) Overlapping analysis of GEO and TCGA datasets.

