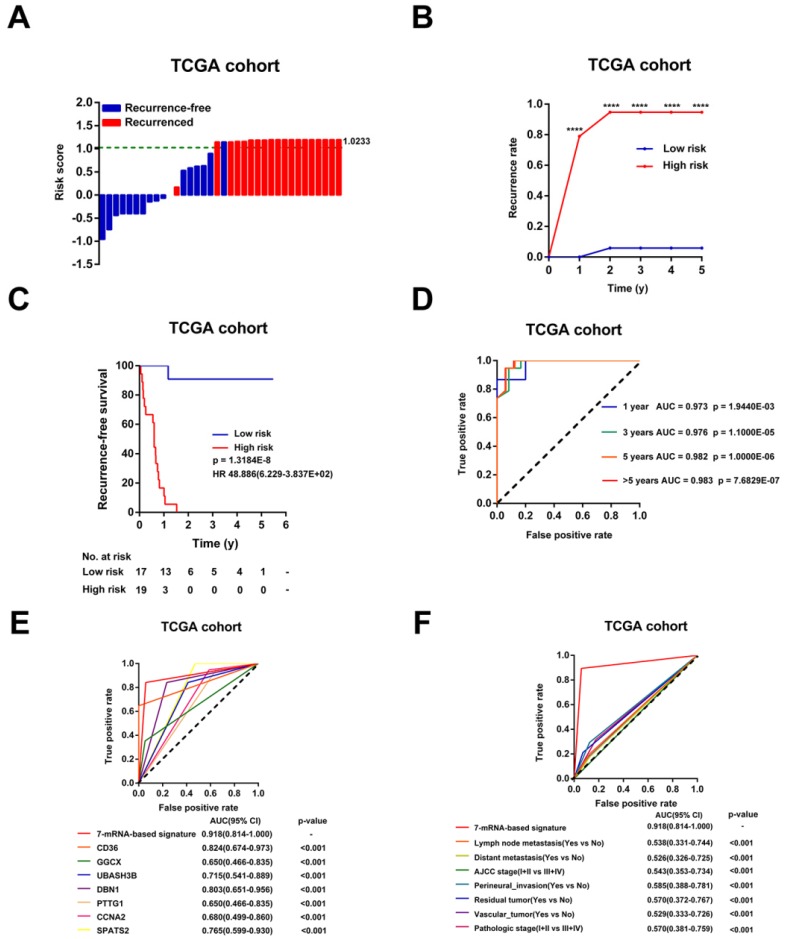
Figure 4.
Evaluation of the risk score formula for relapse in the TCGA cohort. (A) Waterfall plots for distribution of risk score and relapse status of individual patients. (B) Recurrence rate between the high- and low-risk at the indicated time. (C) The Kaplan-Meier survival curve of recurrence-free for patients between two different groups. (D) Time-dependent ROC curve at 1 year, 3 years, 5 years and more than 5 years. (E) Comparison of prognostic accuracy between the signature and single mRNAs. (F) Comparison of prognostic accuracy between the signature and clinical characteristics. P-values were calculated using the log-rank test. HR, hazard ratio; AUC, area under ROC curve; RFS, recurrence-free survival. ****, p <0.001.

