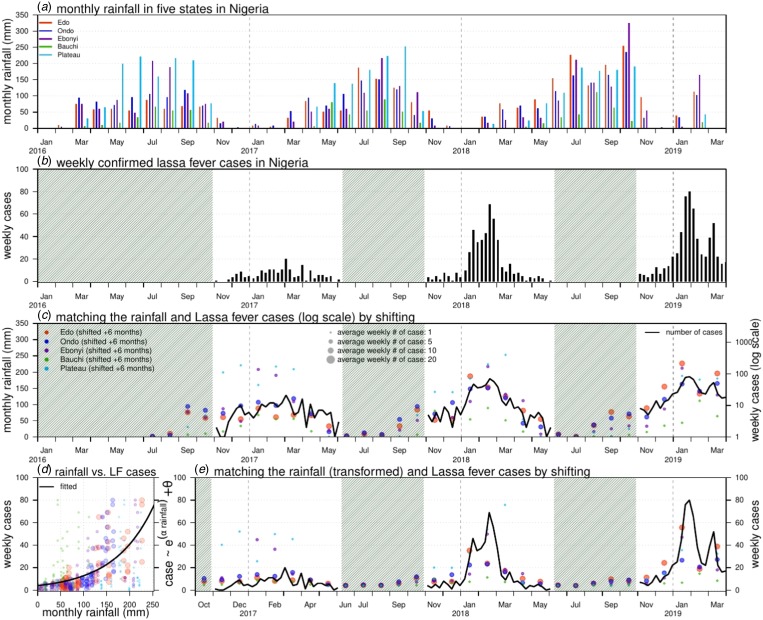
Fig. 1.
Rainfall (unit: mm) and number of Lassa fever (LF) cases in Nigeria. Panel (a) shows the monthly rainfall in five states in Nigeria. Panel (b) shows the weekly number of LF cases in Nigeria. The shaded area represents a weekly number of cases lower than 10. Panel (c) matches the rainfall (dots) and LF cases (in log scale, black line) by shifting the rainfall time series by + 6 months. The sizes of each dot represent the number of the average weekly LF cases in each state in the 2017–18 and 2018–19 outbreaks. Panel (d) is the scatter plot of rainfall (shifted + 6 months) vs. LF cases; the dots of different colours and sizes share the same scheme as in panel (c). The black line is the fitting outcome of the formula ‘case ~ exp(α × rainfall) + θ’ by least square estimation and here, the ‘rainfall’ is the rainfall time series shifted + 6 months. The fitted R-squared is 0.41 and significance is P-value < 0.0001. Panel (e) is the fitting outcome from panel (d) and the rainfall dots (shifted + 6 months) of different colours and sizes share the same scheme as in panel (c).

