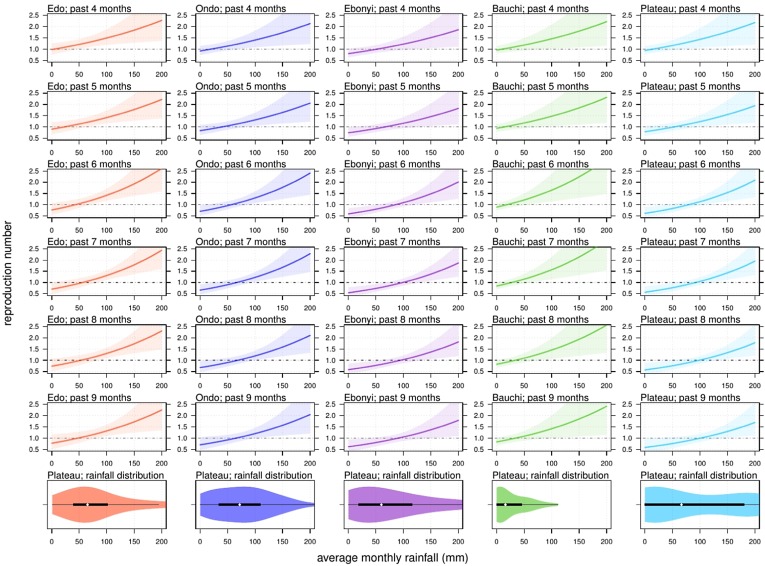
Fig. 5.
The relationship between state rainfall and Lassa fever (LF) transmissibility, i.e. the reproduction number (R), in five different states with different time lags (t). The reproduction number of 1.0 is highlighted by the back dashed line. The panels at the bottom are the violin plots and show the distribution of rainfall in each state. The black rectangles represent the 25% and 75% quantiles and the white dot is the median.

