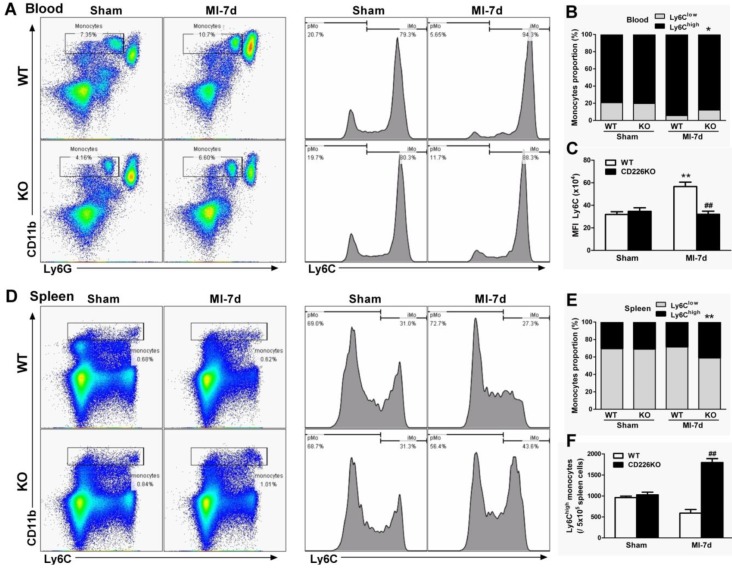
Figure 5.
CD226 depletion restrains monocytes mobilization from the spleen and peripheral blood. A. Representative flow cytometric dot plots and histograms show Ly6Chigh and Ly6Clow monocytes in the peripheral blood of WT and CD226 KO mice 7 days after MI or sham surgery. Numbers indicate the percentage of Ly6Chigh or Ly6Clow cells within the cell population analyzed. B. Ly6Chigh and Ly6Clow monocytes proportion in the blood. * P < 0.05 vs. WT-MI. C. Mean fluorescent intensity (MFI) of Ly6C on peripheral blood Ly6Chigh monocytes at day 7 after MI. n = 6 mice per group. Data are represented as mean values ± SEM. ** P < 0.01 vs. WT-Sham, ## P < 0.01 vs. WT-MI. D. Representative flow cytometric dot plots and histograms show Ly6Chigh and Ly6Clow monocytes in the spleen of WT and CD226 KO mice. Numbers indicate the percentage of Ly6Chigh or Ly6Clow cells within the cell population analyzed. E. Ly6Chigh and Ly6Clow monocytes proportion in the spleen 7 days after MI or sham surgery. ** P < 0.01 vs. WT-MI. F. Number of Ly6Chigh monocytes in the spleen at day 7 after MI. n = 6 mice per group. Mean values ± SEM are represented. ## P < 0.01 vs WT-MI.

