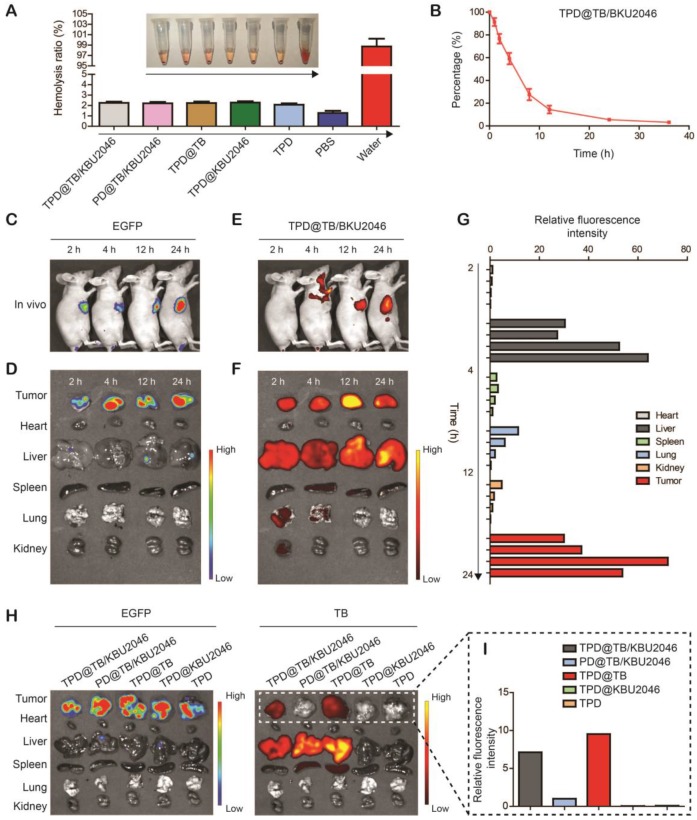
Figure 4.
(A) Hemolysis assay after incubated with TPD@TB/KBU2046 PD@TB/KBU2046, TPD@TB, TPD@KBU2046, TPD, PBS (negative control), and ultrapure water (positive control) for 3 h in dark. The results were presented as the mean ±SD (n =3). (B) Circulation profile of TPD@TB/KBU2046 (2.0 mg/ml, 200 μl) in normal BALB/c female mice after injection via the tail vein. The results were presented as the mean ±SD (n =3). (C/D) EGFP imaging (Ex=500 nm, Em=540 nm) of EGFP-SKOV-3 tumor-bearing mice after injection of TPD@TB/KBU2046 (2.0 mg/ml, 200 μl) for 2 h, 4 h, 12 h and 24 h via the tail vein. (E/F) Biodistribution of TPD@TB/KBU2046 (Ex =540 nm, Em =680 nm) in different organs and tumors in EGFP-SKOV-3 tumor-bearing mice after injected with TPD@TB/KBU2046 for 2h, 4h, 12h and 24 h via the tail vein. (G) The relative fluorescence intensity of each harvested tumors and organs were measured with a semi-quantitative biodistribution analysis. (H) Fluorescence images of EGFP and TB in different organs and tumors 48 h after the tail vein injection of TPD@TB/KBU2046, PD@TB/KBU2046, TPD@TB, TPD@KBU2046 and TPD, respectively. The coloured spectrum gradient bar indicated the fluorescence intensity. (I) Relative fluorescence intensity of each harvested tumors was measured with a semi-quantitative biodistribution analysis.

