Figure 2.
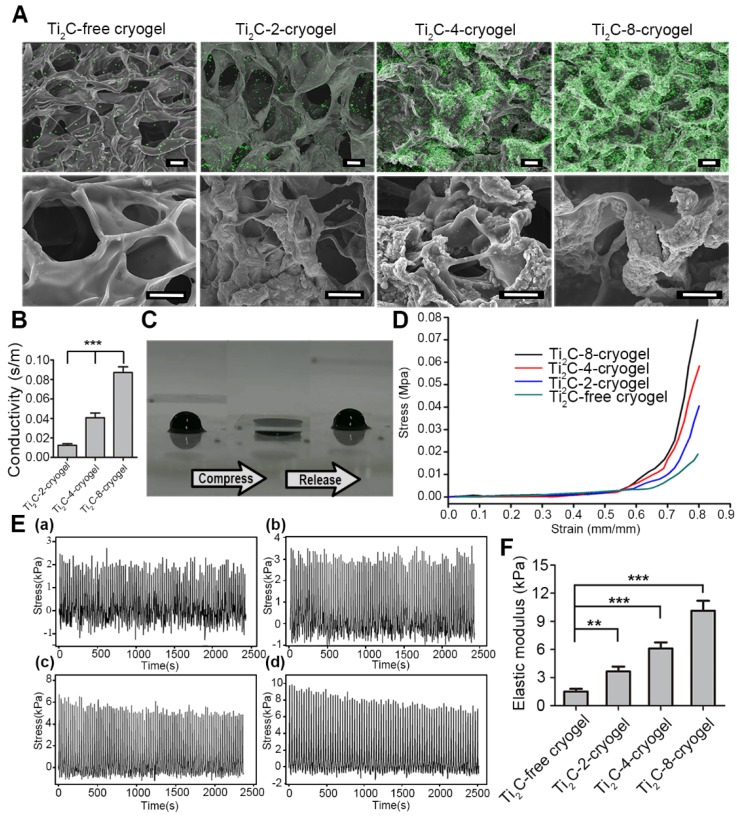
Characterization of the Ti2C-free cryogel and the different Ti2C-cryogels. A) Atomic distribution maps (up) and SEM images (bottom) of all the cryogels showed that the Ti2C nanoparticles well distributed on the inside wall of the porous cryogels in different Ti2C-cryogel groups. Green spots represented the Ti element. Scale bars (up)= 50 μm, Scale bars (bottom) = 25 μm. B) Electrical conductivities of the different Ti2C-cryogels. n = 5. ***p<0.001. C) Excellent-resilience of the Ti2C-8-cryogel. D) Stress-strain curves of the different cryogels. n = 3. E) The stress-time curve of different cryogels compressive cycling test up to 60 % deformation for 100 cycles. F) Elastic modulus of the different cryogels. n = 3. **p<0.01, ***p<0.001

