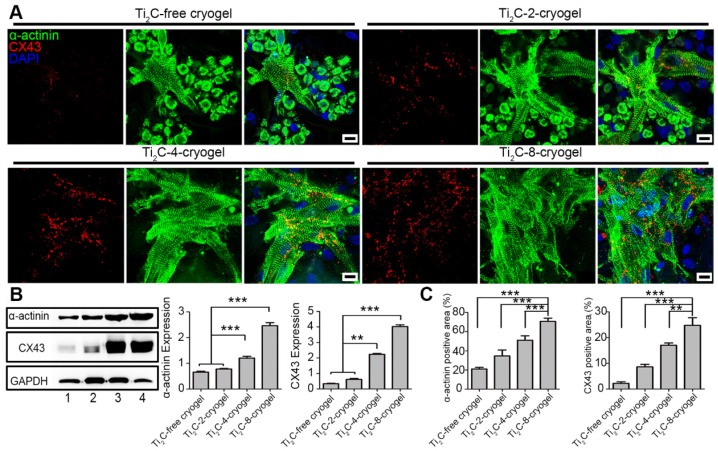
Figure 5.
Expression of cardiac-specific proteins in CMs cultured on different ECPs on day 7. A) Immunofluorescence images of α-actinin and CX-43 proteins of CMs on different cryogels on day 7. Scale bars = 10 μm. B) Western blotting and the quantification for the expressions of α-actinin proteins and CX-43 proteins in CMs on different ECPs on day 7 of culture. Line 1: Ti2C-free cryogel. Line 2: Ti2C-2-cryogel. Line 3: Ti2C-4-cryogel. Line 4: Ti2C-8-cryogel. n = 3. **p < 0.01, ***p < 0.001. C) α-actinin and CX43 positive area coverages of CMs based on the immunofluorescence images. n = 4. **p < 0.01, ***p < 0.001.

