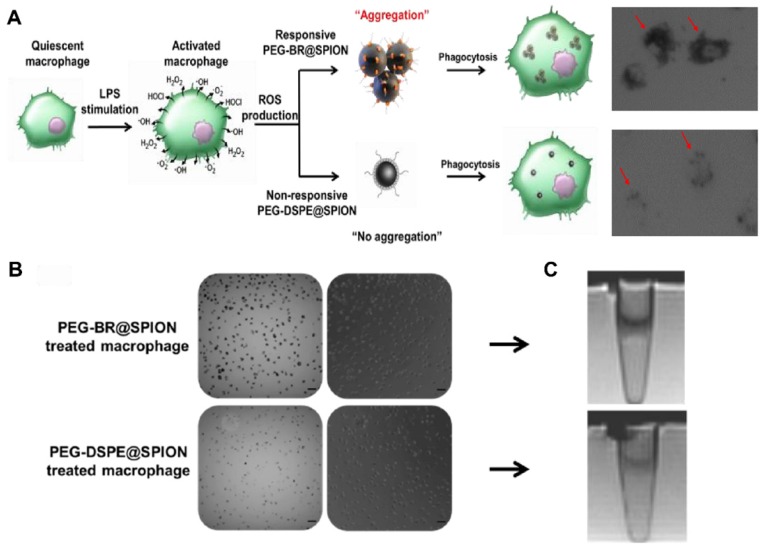
Figure 3.
In vitro ROS-responsiveness of the PEG-BR@SPIONs. (A) Schematic figure with corresponding enlarged images of cell uptake showing differences in intracellular uptake of two types of SPIONs by LPS-stimulated macrophages. (B) Bright-field and phase-contrast images of RAW 264.7 cells 6 hours after treatment with LPS and each SPION (Scale bar: 50 µm). (C) Corresponding T2 MR phantom images of RAW 264.7 cells (n = 3).

