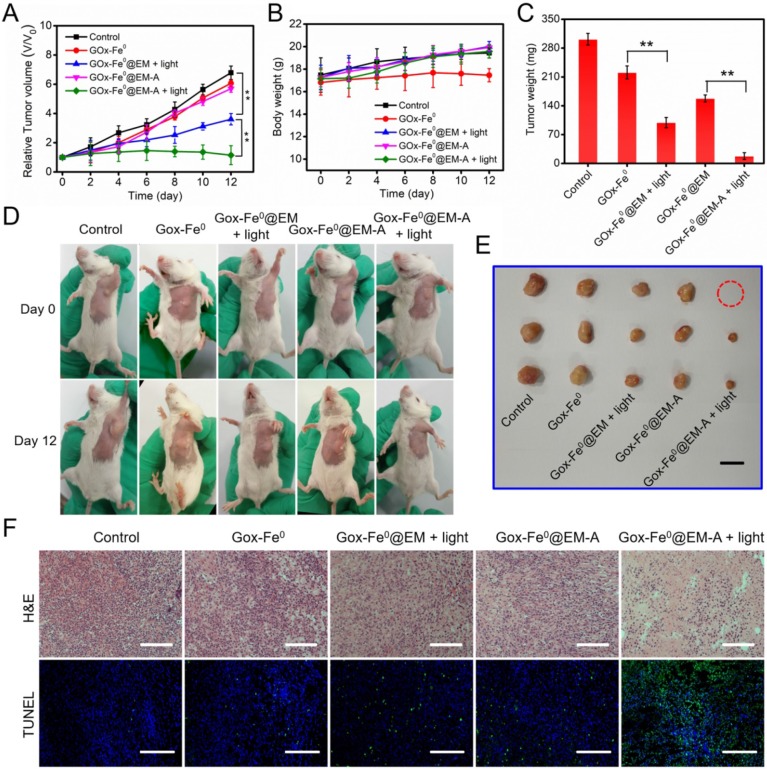
Figure 6.
(A) Relative tumor volume and (B) body weight changes in 12 days after various treatments. **P < 0.01. (C) The average tumor weight after various treatments.**P < 0.01. (D) Photographs of C6 tumor-bearing BALB/c mice on Day 0 and Day 12. (E) Representative photographs of tumors. (F) H&E and TUNEL stained tumor slices after different treatments. The H&E scale bars represent 100 µm. The TUNEL scale bars represent 200 µm.

