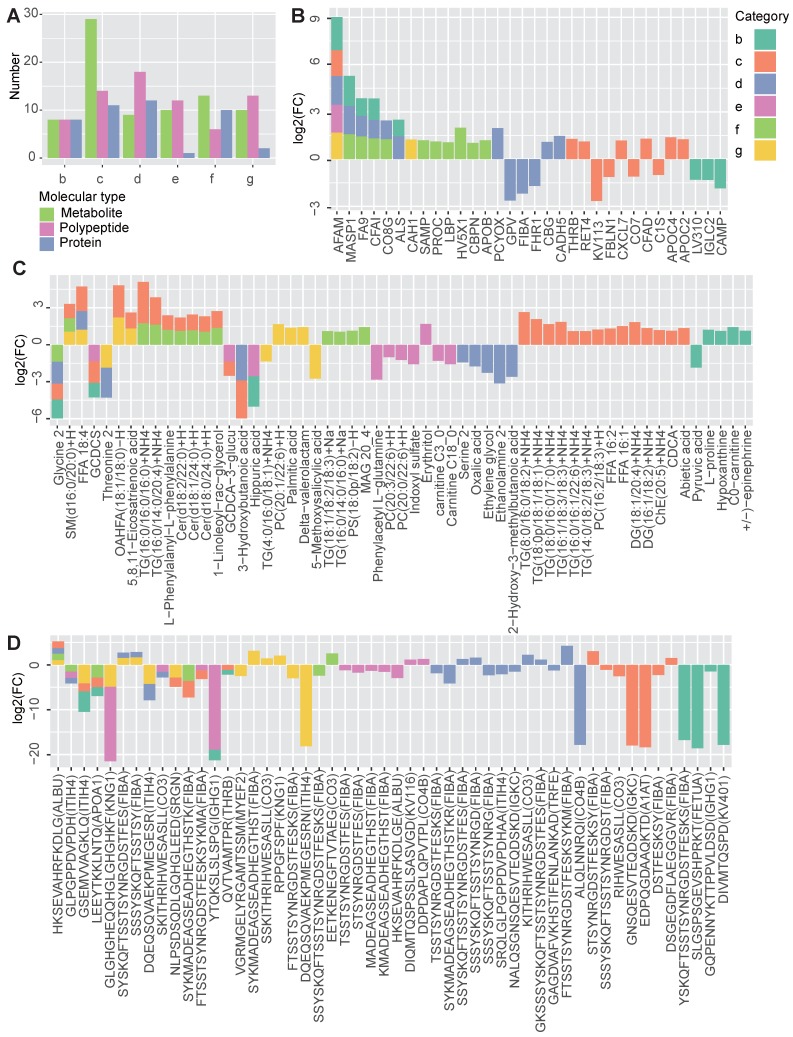
Figure 2.
Shared and specific molecular features of the metabolic diseases. A The number of differentially expressed metabolites, polypeptides and proteins obtained by comparing each disease group (B to G) to the normal group. B-D The profiles of the shared and specific alterations for all disease groups in terms of proteins (B), metabolites (C) and polypeptides (D). The bar colors represent the disease groups. The vertical axis represents the log2-changed fold change between two groups (the mean value of the disease group divided by that of the normal group), while the horizontal axis represents different molecules. The source protein names for the polypeptides are annotated in the brackets after the polypeptide names. n =7 for each group.

