Figure 3.
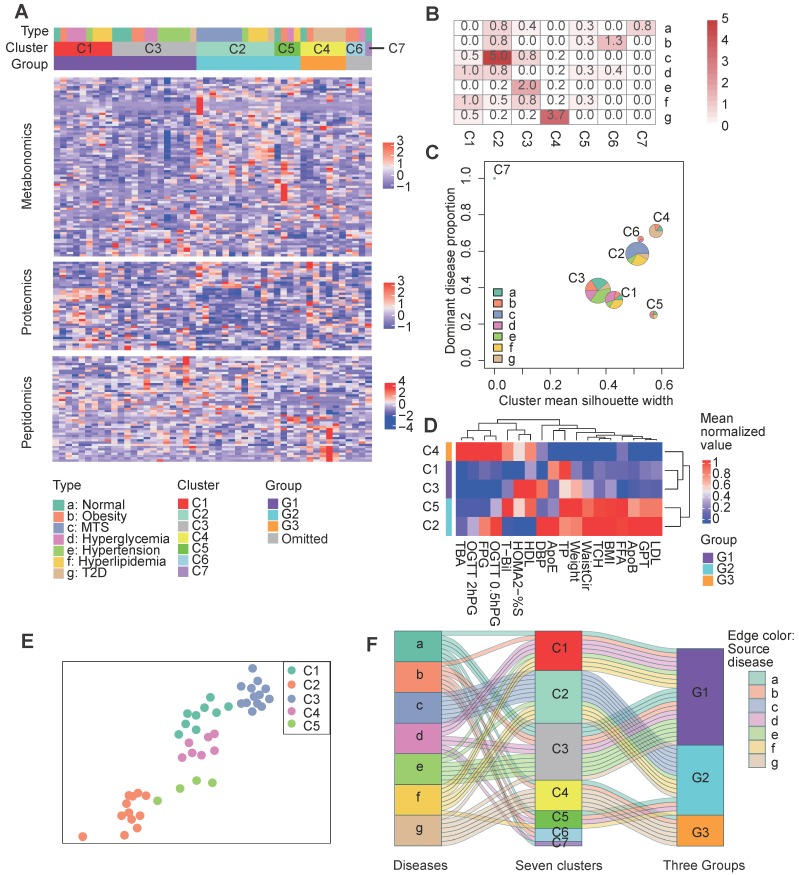
Clustering of patients based on both clinical factors and multi-omics data. A Clustering results. The central heatmap displays the normalized expression of clinical factor-relevant molecules (see Methods) according to metabolomics, proteomics and peptidomics, in which each column corresponds to a patient and each row corresponds to a molecule. Above the heatmap, the three rows indicate the original patient groups (A to G), the first-step clustering results (seven clusters: C1 to C7) and the three combined groups (G1 to G3). See the Methods for the detailed clustering methods. B Significance of the overlaps between the different clusters (represented by the columns) and the patient groups (represented by the rows) according to Fisher's exact test. C Visualization of the cluster composition and homogeneity. Each pie represents the disease-type composition within an individual cluster, and the size is proportional to the number of samples. The x and y coordinates represent the cluster silhouette width and the proportion of the most dominant disease type within a cluster, respectively. D The second step clustering results. The heatmap displays the mean cluster levels in a collection of clinical factors. E The force-directed map layout was computed from a combined similarity matrix calculated as the dot product of the consensus clustering matrix and a differential clinical factor-based Spearman correlation matrix for the samples, and similar samples are positioned close to each other. F The Sankey diagram describes the relationships between the original disease types, the initial seven clusters and the three combined groups. C1, n= 9; C2, n=12; C3, n=13; C4, n=7; C5, n=4; C6, n=3; C7, n=1. 0.5hPG: 0.5-hour postprandial plasma glucose; 2hPG: 2-hour postprandial blood glucose; ApoB: apolipoprotein b; ApoE: apolipoprotein e; BMI: body mass index; DBP: diastolic blood pressure; FFA: free fatty acids; FPG: fasting plasma glucose; GPT: glutamic pyruvic transaminase; HDL: high density lipoprotein; HOMA2: homoeostasis model assessment 2; LDL: low density lipoprotein; MTS: metabolic syndrome; OGTT: oral glucose tolerance test; %S: insulin sensitivity index; T2D: type 2 diabetes; TBA: total bile acid; T-Bil: total bilirubin; TP: total protein; WaistCir: waist circumference.

