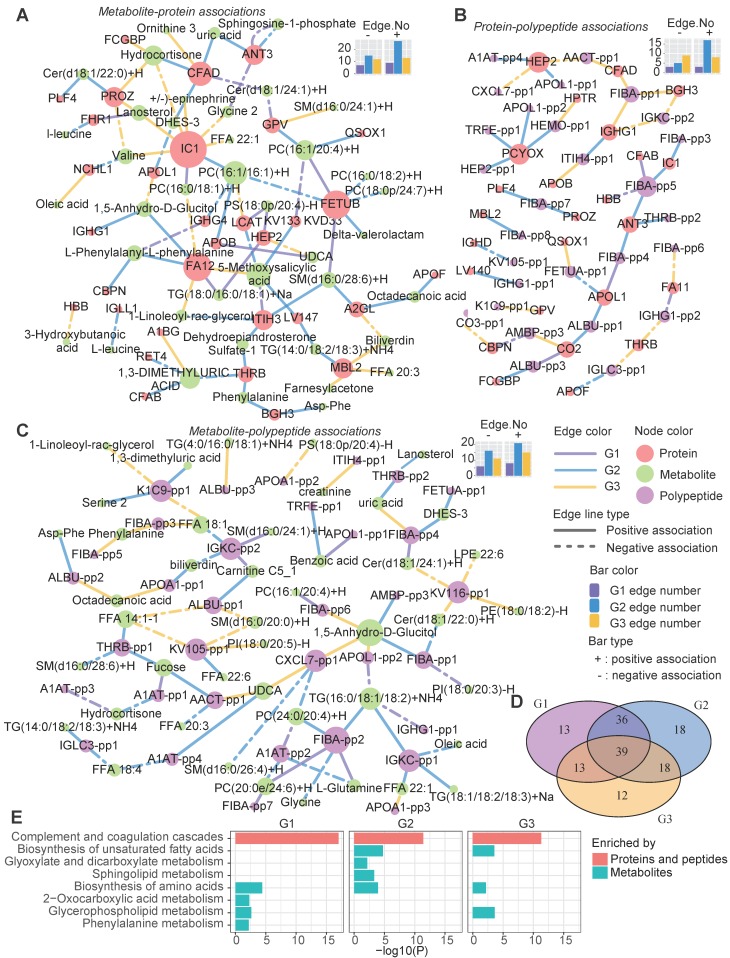
Figure 6.
Heterogeneous molecular network dynamics in the three metabolic disease groups. A-C Significant associations between metabolites and proteins (A), proteins and peptides (B), and metabolites and peptides (C) in the G1, G2 and G3 samples (absolute value of the correlation coefficient > 0.6, P < 0.01). The associations were estimated by biweight midcorrelations, and the corresponding Student p-values were calculated. The node colors represent the molecular types. The solid and dashed lines represent positive and negative correlations, respectively, between the connected nodes. The edge colors indicate in which groups the associations were found. The top-right bar plots summarize the positive (+) and negative (-) edge numbers (Edge.No) in different groups. For clarity, the peptides are represented by abbreviated names; see Table S3 for the detailed peptide information. D The overlap among the network nodes for different groups. E Pathway enrichment analysis of the network nodes for different groups. The bar lengths are proportional to -log10(P), and the bar colors indicate whether the pathways were enriched in proteins (both proteins and source proteins of the peptides) or metabolites.

