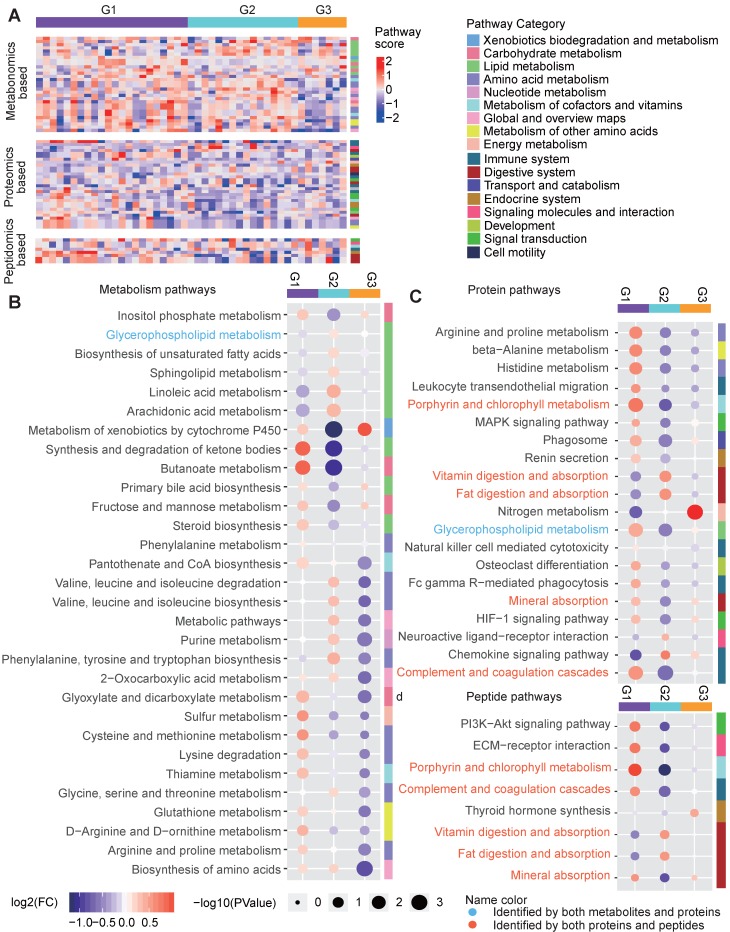
Figure 7.
Pathway characteristics of the three metabolic disease groups. A Pathway profile of samples in the three main groups. For every pathway, the GSEA method was applied to examine whether the members of the pathway were enriched at the top or bottom of the ranked molecular list for an individual sample with respect to each type of omics data (see Methods). The pathway category is annotated at the right side of the heatmap. B-D Top-ranked differential pathways in the three groups identified based on the metabolomics (B), proteomics (C) and peptidomics (D) profiles, respectively. Random forest-based important scores for the pathways were also calculated to estimate the importance of a pathway in predicting the group labels. Then, the top-half ranked pathways (the number of top-half metabolomics-based pathways was larger than 30, so we only displayed the top 30 for clarity) were further examined. The GSEA-based pathway scores in the samples in each pathway were normalized by subtracting the minimum level. The circle colors represent the log2-transformed fold change of the normalized GSEA scores for a certain pathway between one group and the others. The circle size is proportional to the -log10(P), for which the P values were calculated by the Wilcox test (two-sided, unpaired). GSEA: gene set enrichment analysis.

