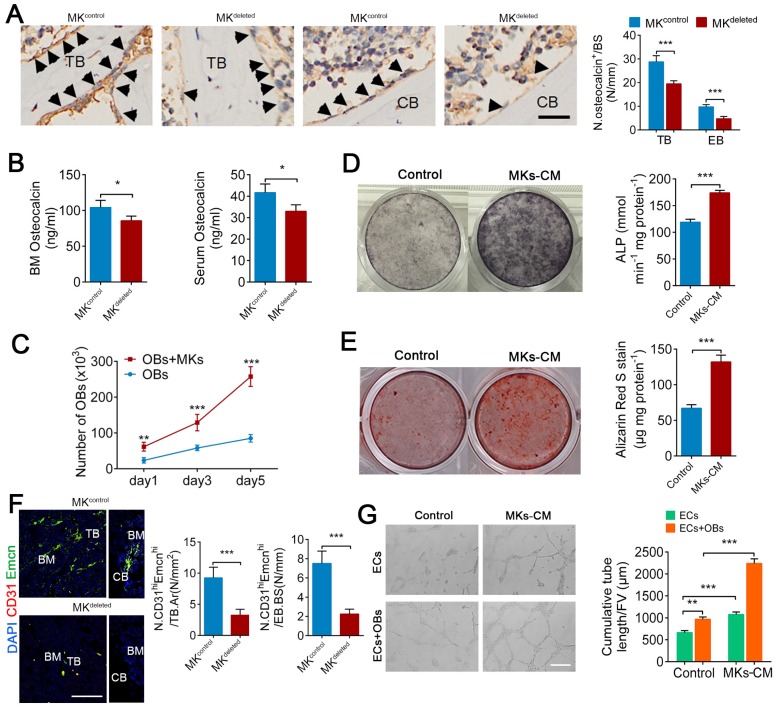
Figure 2.
MKs promote OBs proliferation and differentiation, as well as ECs tube formation. (A) Representative immunostaining images of osteocalcin+ cells (arrowheads) on the surfaces of TB and EB from MKdeleted mice and their littermate controls (n=6 mice per group). The quantification of osteocalcin+ cells are shown in the right panel. Scale bar, 100 µm. (B) The concentration of osteocalcin in the BM and serum of MKdeleted mice and their littermate controls, determined by ELISA (n=6 mice per group). (C) Proliferation of OBs in direct culture with MKs for 5 days (n=6 per group). (D) Pre-OBs were induced differentiation into mature OBs in osteogenic differentiation medium without or with MKs-CM from WT mice after 7 days. Representative alkaline phosphatase staining images (left) and quantification of the activity of alkaline phosphatase was calculated (right) (n=6 per group). (E) Pre-OBs were induced differentiation into mature OBs in osteogenic differentiation medium without or with MKs-CM from WT mice after 21 days. Representative Alizarin red staining images (left) and quantification of matrix mineralization was calculated (right) (n=6 per group). (F) Representative immunostaining images of CD31 (red) and Emcn (green) in the BM (left) and endocortical bone surfaces (right) of MKdeleted mice and their littermate controls. The quantification of CD31hi Emcnhi (yellow) cells are shown in the right panel (n=6 mice per group). Scale bar, 100 µm. (G) Representative images of tube formation of ECs (with or without co-cultures of OBs) after addition of MKs-CM. The quantitative analysis of cumulative tube length is shown in the right panel (n=6 per group). Scale bar, 100 µm. Data are shown as mean ± SD. *P < 0.05, **P < 0.01, ***P < 0.001. For all panels in this figure, data are representative of three independent experiments.

