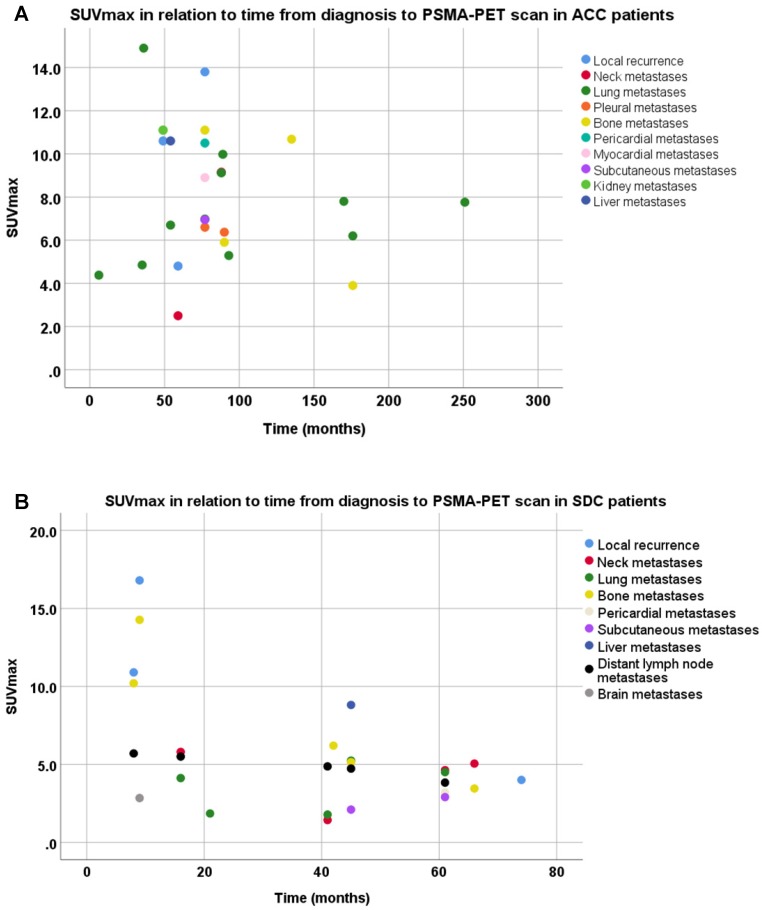
Figure 2.
Scatter plot of the time from diagnosis to PSMA-PET scan and maximum standardized uptake value's (SUVmax) per disease site in recurrent and metastatic lesions of adenoid cystic carcinoma patients (A) and salivary duct carcinoma patients (B). Note that patients with x disease site are represented in the figures x times.

