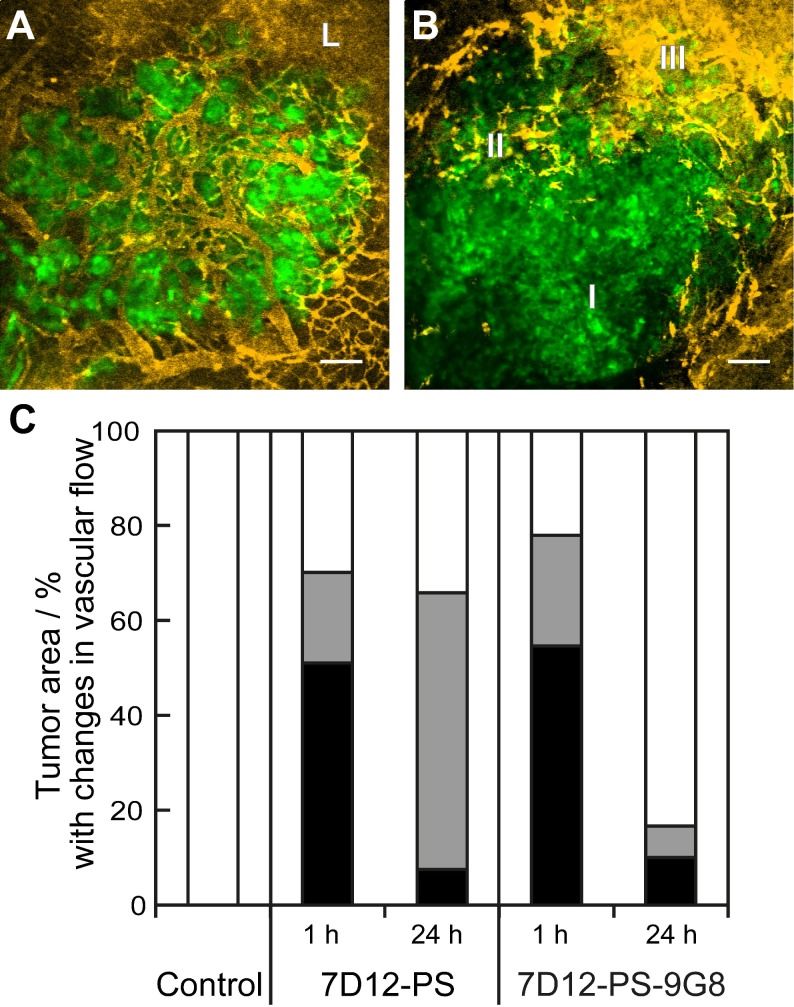
Figure 5.
Representative images showing the different tumor vascular responses observed 2 h after PDT recorded using GFP fluorescence (green) and tertramethylrhodamine dextran fluorescence (yellow). Bar is 100 µm. (A) Normal blood flow in the tumor and leakage (L) just outside the tumor. (B) Tumor with an area of no flow (I), reduced flow (II) and normal flow with leakage (III). (C) Qualitative analysis of vascular flow in tumor determined 2 h after PDT using 7D12-PS or 7D12-9G8-PS and illuminated either at 1 or 24 h post administration. The relative area in tumor that showed either no flow (black), reduced flow (gray) or normal flow (white) was determined and averaged in 6 animals.

