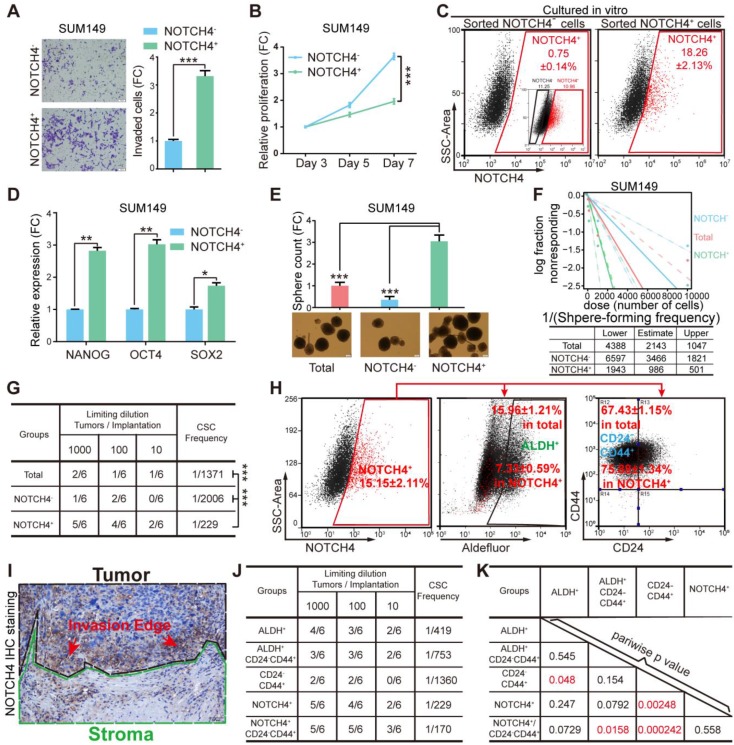
Figure 2.
NOTCH4 enriched BCSCs in TNBC cells. (A-F) NOTCH4+ and NOTCH4- cells were sorted from SUM149 by FACS to measure the following characteristics: (A) invasion ability by transwell assay; (B) proliferation ability by MTT assay; (C) in vitro differentiation ability by flow cytometry with the initial FACS graph showed as an insert; (D) fold change of stemness gene expression level by qRT-PCR, with TBP used as internal control; (E) mammosphere formation ability, Scale bar: 100 μm. (F) Serial dilution assay was performed to determine the sphere-formation frequency; data was calculated by the online tool ELDA. (G) Sorted SUM149 cells were transplanted in situ into nude mice at indicated serial dilutions to assess the BCSC frequency; data was calculated by the online tool ELDA (http://bioinf.wehi.edu.au/software/elda/). (H) NOTCH4, ALDEFLUOR and CD24/CD44 were co-stained to determine the percentage of overlapping population in SUM149. (I) A representative picture of IHC staining of NOTCH4 in TNBC paraffin sections, using dashed lines to indicate the tumor and stroma edges. (J-K) Comparison of BCSC enrichment ability between NOTCH4 and the present commonly used BCSC markers as well as their combinations, using serial transplantation assay of SUM149, CSC frequency (J) and pairwise p values (K) were calculated. Triple independent experiments were carried out and representative results were shown. * P<0.05, ** P<0.01, *** P<0.001.

