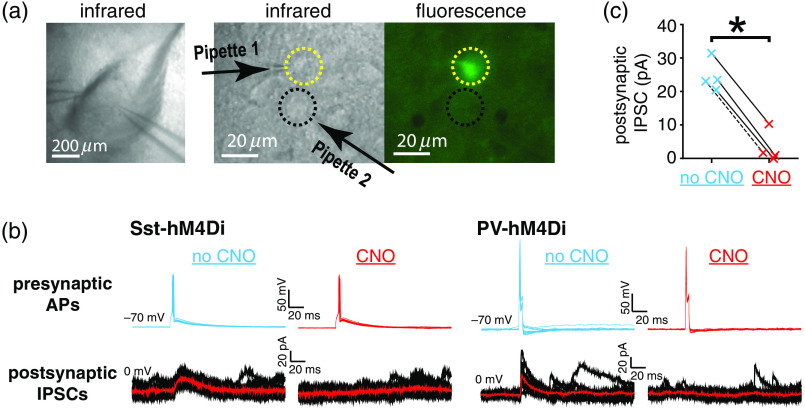
Fig. 1.
DREADD suppresses GABA release from BLA INs during APs. (a) Example of the paired whole-cell recording from a BLA slice. (a) Left: Infrared (IR) image at low magnification. Right: high magnification IR and fluorescent images. Dotted yellow and black circles indicate an Sst-IN expressing hM4D(Gi)-citrine identified by fluorescence and a putative PN, respectively. (b) Examples of double patch recordings of APs evoked by current injection in the INs (400 pA, every 15 s) (upper) and of the corresponding IPSCs in the connected PNs (lower), in the absence of CNO (no CNO, blue) and after 10 min perfusion with CNO (CNO, red). Fifteen traces and IPSC averages (red line) are shown for a pair with an Sst-IN [left, Sst-hM4(Di)] and a pair with a PV-IN [right, PV-hM4(Di)]. (c) Summary data for IPSC amplitudes (, including three pairs with Sst-INs, data point connected with continuous lines, and one pair with PV-IN, data points connected with dashed line) in the absence and presence of CNO. *, Mann–Whitney test.

