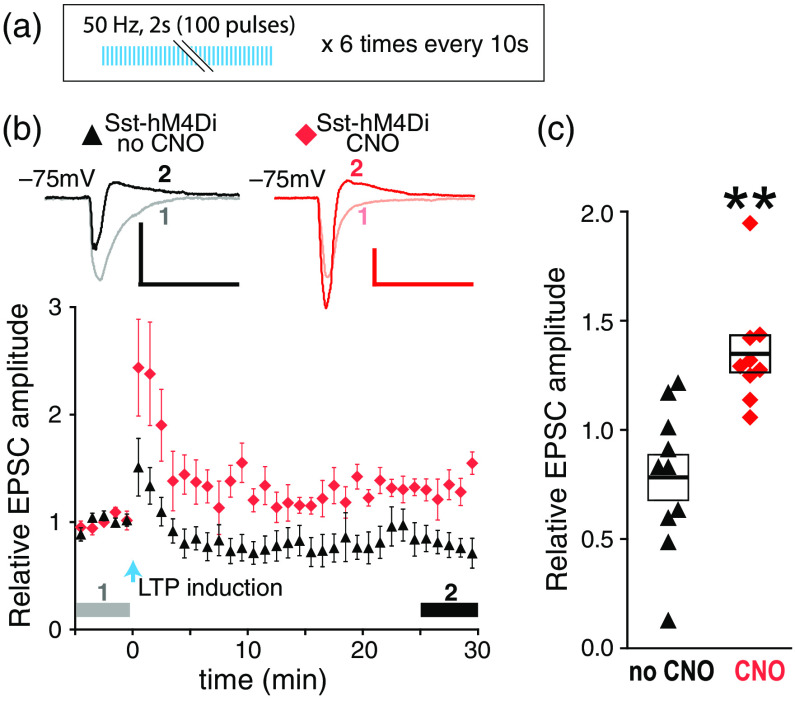
Fig. 2.
DREADD suppression of Sst-INs enables the facilitation of EPSCs in dmPFC-BLA pathway. (a) LTP induction protocol and (b) relative EPSC amplitudes. Symbols (black triangles: no CNO, red diamonds: CNO) represent the average amplitudes of two consecutive EPSCs recorded during each minute. Upper insets: examples of averaged EPSCs before (1) and after (2) LTP induction as indicated by horizontal gray and black bars, respectively. Scales: 100 pA, 50 ms. (c) Relative EPSC amplitudes averaged during (2) for each neuron. from six mice (no CNO) and nine cells/slices from five mice (CNO). **, compared to 1, which is the averaged relative EPSC amplitude during the baseline indicated by gray bars (1), one-sample -test. Error bars on panel (b) represent standard error of the mean (SEM). Boxes and the thick bars inside on panel (c) represent SEM and means.

