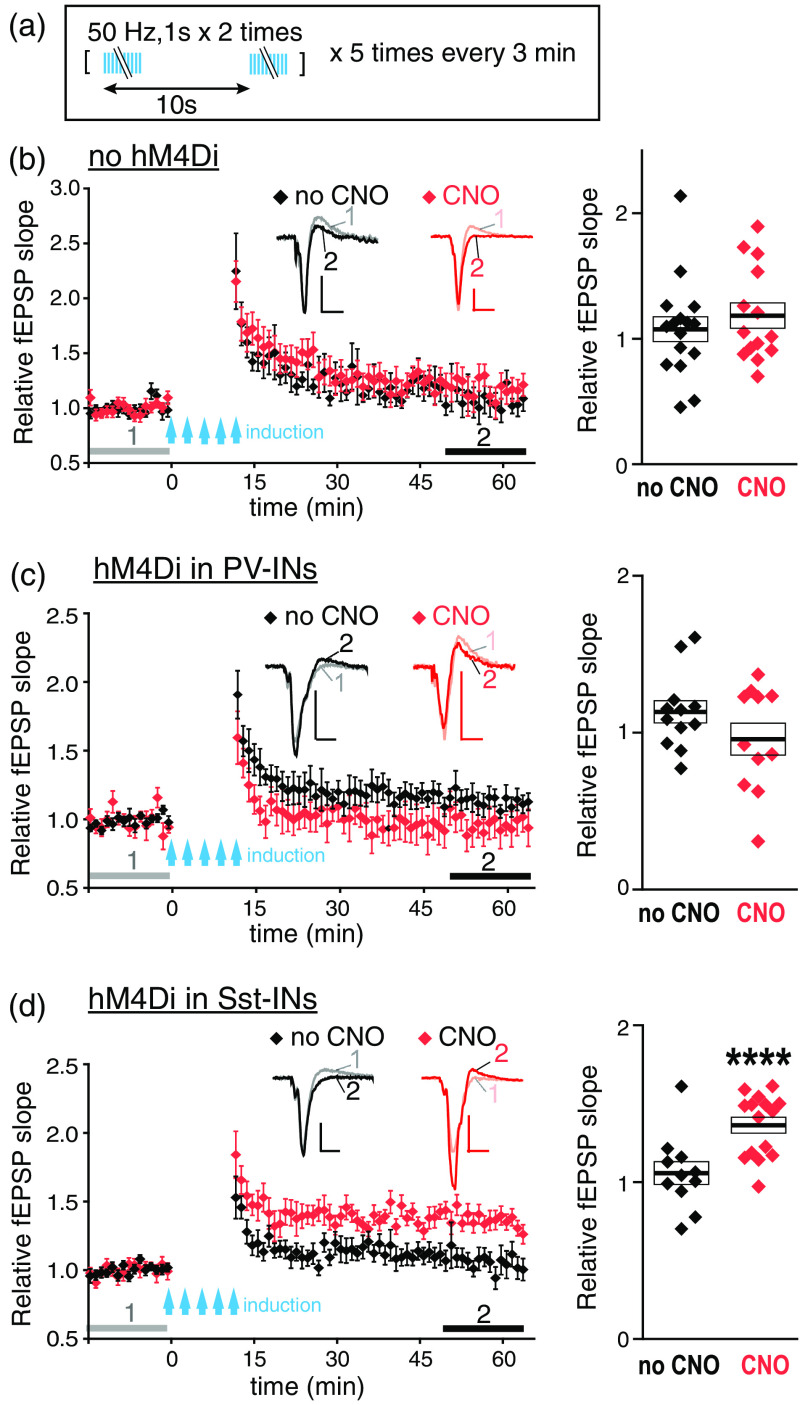
Fig. 3.
DREADD suppression of Sst-INs enables facilitation of LFPs evoked in the dmPFC-BLA pathway. (a) LTP induction protocol. (b–d) LTP experiments on slices without hM4Di (b), with hM4Di expressed in PV-INs (c), and with hM4Di expressed in Sst-INs (d). Left: relative fEPSP slopes. Symbols on the diagram represent the averages of three consecutive data points obtained every 20 s. Insets represent examples of averaged fEPSPs before (1) and after (2) LTP induction, as indicated by horizontal gray and black bars. Scales: 0.1 mV, 10 ms. Right: relative fEPSP slopes averaged during (2) for each slice. slices from four mice (no CNO) and 14 slices from five mice (CNO) in (b). slices from four mice (no CNO) and 11 slices from four mice (CNO) in (c). slices from three mice (no CNO) and 15 slices from six mice (CNO) in (d). ****, compared to 1, which is the averaged relative fEPSP slope during the baseline indicated by gray bars (1), one-sample -test. Boxes and the thick bars inside represent SEM and means.

