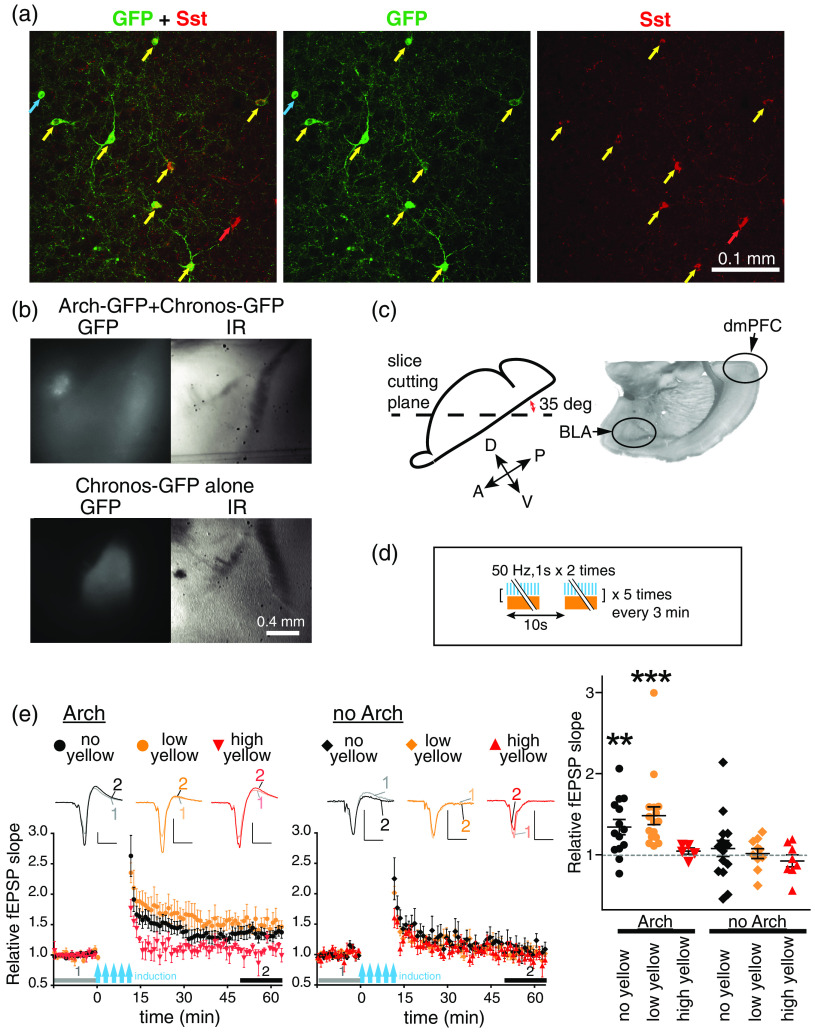
Fig. 4.
Arch suppression of Sst-INs enables LTP induction. (a) Arch-GFP is expressed mostly in Sst-INs of BLA of an Sst-Cre driver mouse transduced with the floxed Arch AAV in BLA. Confocal image of the somatostatin immunostaining (right panel, Sst, red), Arch-GFP fluorescence (center, GFP, green) and the merged image (left, GFP + Sst). Yellow arrows indicate coexpression of Arch-GFP and Sst, red—Sst only, blue—Arch-GFP only. (b) Examples of slices used for recording. Upper: BLA slice from an Sst-Cre driver mouse transduced with Chronos-AAV in dmPFC and floxed Arch AAV in BLA. Lower: the slice from a mouse transduced only with Chronos-AAV in dmPFC. Fluorescent (GFP) and IR images of the same slices are shown. (c) Left: slice cutting plane. Right: a visible light image of a fixed BLA slice cut under the same angle as the “live” slices used for recording. (d) LTP induction protocol. (e) LTP experiments on slices with Arch (left) and without Arch (middle) in Sst-INs, with LTP induced using pulses of blue light alone (black circle: no yellow) or combined with the continuous yellow light of two intensities: (orange circles: low yellow) and (red inverted triangles: high yellow). Insets represent examples of averaged fEPSPs before (1) and after (2) LTP induction as indicated by horizontal grey and black bars. Scales: 0.2 mV, 10 ms. Right: Summary data for relative fEPSP slopes averaged during (2) for each slice. slices from 4 mice (Arch-no yellow), slices from 10 mice (Arch-low yellow), slices from 3 mice (Arch-high yellow), slices from 4 mice (no Arch-no yellow), slices from 5 mice (no Arch-low yellow), and slices from 7 mice (no Arch-high yellow). **, ***, compared to 1, which is the averaged relative fEPSP slope during the baseline indicated by gray bars (1), Wilcoxon’s signed rank test. Boxes and the thick bars inside represent SEM and means.

