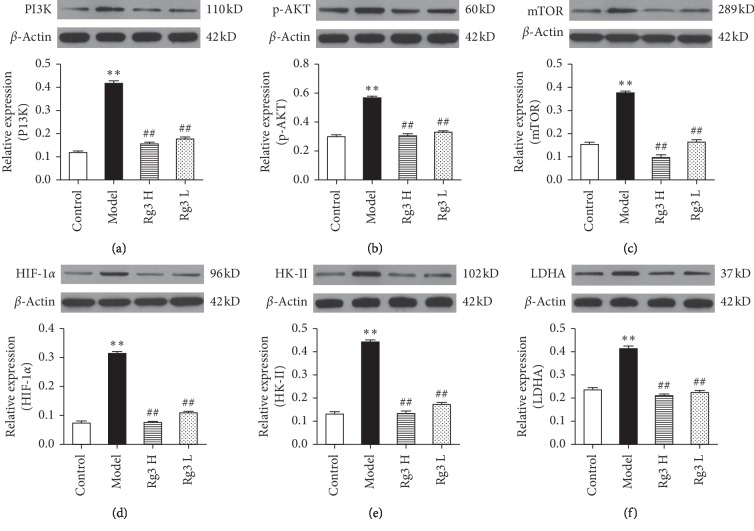
Figure 4.
Protein expression of glycometabolic-related proteins in the gastric mucosa of Atp4a−/− mice treated with Rg3 based on western blotting results and quantification of band intensities in each blot for (a) PI3K, (b) p-AKT, (c) mTOR, (d) HIF-1α, (e) HK-II, and (f) LDHA. Upregulation of PI3K, p-AKT, mTOR, HIF-1α, HK-II, and LDHA proteins in the gastric mucosa of Atp4a−/− mice compared to levels in the WT control group. Data are shown as mean ± SEM (n = 6). ∗∗P < 0.01 versus the WT control group. ##P < 0.01 versus the model group.

