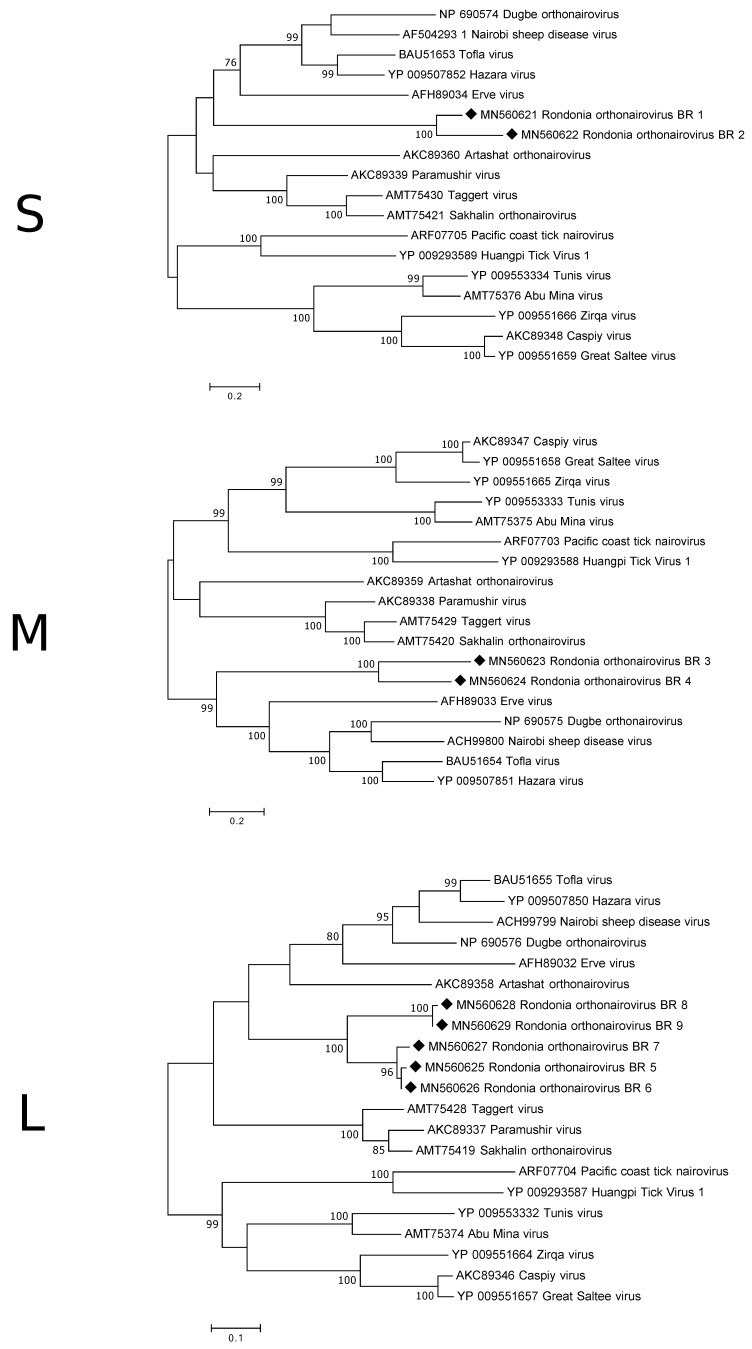
Figure 2.
Phylogenetic analysis of the S-, M- and L-segment of orthonairoviruses. The map was inferred using the Maximum Likelihood method with a bootstrap of 500. There was a total of 238 (S-segment), 1101 (M-segment) and 208 (L-segment) positions, respectively, in the final data set. The black diamond marks the sequences obtained from this study.

